
SPORTS DATA ANALYTICS

NPFL Data Analytics

Analysing Geography, Population, Club Performance and League Competitiveness in the NPFL

A six-season football analytics project examining the relationship between geography, population and club performance in the Nigerian Premier Football League, while also exploring league competitiveness, home advantage, player contribution, stadium environments and match-outcome prediction.

2,095 Matches
4,368 Goals
32 Clubs
6 Seasons

THE CENTRAL QUESTION

Does population and geography explain football performance in the NPFL?

The analysis suggests that population size alone does not explain club performance. Instead, the strongest patterns emerge around sustained club performance, home advantage, competitive balance, player contribution and the broader sporting environment.

PROJECT OBJECTIVE

Moving beyond the league table

This project analyses six seasons of NPFL data from 2020/21 to 2025/26 to investigate the relationship between geography, population and football performance.

The analysis also evaluates league competitiveness, team and player performance, home advantage, stadium environments and the potential for match-outcome prediction.

The objective was not simply to describe what happened in the league, but to investigate the patterns behind performance and identify what the findings could imply for the wider NPFL ecosystem.

ANALYTICAL QUESTIONS

What was the analysis trying to discover?

Geography & Population

  • Do clubs from more populated states perform better?
  • Does population size explain differences in club PPG?
  • Are there meaningful differences between geopolitical zones?
  • Is there evidence of a simple north-versus-south divide?

Club Performance

  • Which clubs have been strongest across six seasons?
  • Which clubs have improved or declined?
  • Which clubs demonstrate sustained Top-5 performance?

League Competitiveness

  • Is the gap between stronger and weaker clubs changing?
  • Is variation in club PPG increasing or decreasing?
  • Has competitive balance improved?

Home Advantage

  • How much stronger are clubs at home?
  • Which clubs have the largest home/away PPG differences?
  • Does home advantage remain consistent across seasons?

Player Performance

  • Who are the leading goal scorers?
  • How does scoring relate to appearances?
  • Which players demonstrate strong scoring efficiency?
  • Which positions contribute most to goals?

Stadium & Match Environment

  • Which stadiums host the most matches?
  • Does stadium capacity correspond with match usage?
  • Which stadiums have higher average goals per match?
  • Which stadiums show the strongest home advantage?

Predictive Modelling

  • Which match-performance variables are most useful for predicting match outcomes?
  • Can historical team and match statistics meaningfully distinguish home wins, draws and away wins?

DATASET

Six seasons of NPFL football

The analysis covers six NPFL seasons from 2020/21 to 2025/26. The 2022/23 season is treated separately where appropriate because it was an abridged season.

Season Coverage
2020/21 Included
2021/22 Included
2022/23 Abridged season
2023/24 Included
2024/25 Included
2025/26 Included
2,095 Matches
4,368 Goals
32 Clubs
2.08 Goals per Match

DATA ARCHITECTURE

From licensed football data to analytical insight

01 Licensed Football Data

Source datasets obtained through a paid FootyStats subscription.

↓
02 Data Cleaning & Preparation

Data-quality assessment, cleaning and feature preparation.

↓
03 SQL Server Data Warehouse

Structured relational warehouse using staging, dimensions and facts.

↓
04 Python Statistical Analysis

Exploration, correlations, competitiveness, player analysis and modelling.

↓
05 Power BI / DAX

Interactive reporting, ranking logic and season-aware measures.

↓
06 Analytical Report

Insights, recommendations and strategic implications.

SQL SERVER

Building the analytical warehouse

SQL Server was used to transform the source datasets into a structured analytical warehouse.

The warehouse follows a dimensional modelling approach with three main schemas:

stg Staging
dim Dimensions
fact Facts

Dimension tables include states, seasons, players, dates, stadiums and teams.

Fact tables include matches, player statistics and team statistics.

Relational Data Modelling Star Schema Primary Keys Foreign Keys Staging Tables BULK INSERT TRY_CAST() Data Validation

PYTHON ANALYSIS

Turning match data into statistical evidence

Python served as the main statistical and analytical layer, covering team performance, player analysis, geographic relationships, competitiveness and predictive modelling.

Team Performance

Matches, wins, draws, losses, goals, goal difference, points, PPG, home PPG, away PPG and league position.

Player Analysis

Goals, appearances, minutes, goals per 90, position, contribution and expected goals where available.

Geographic Analysis

State population, geopolitical zones and the relationship between geography and performance.

Competitiveness

PPG variation, coefficient of variation and the changing gap between stronger and weaker clubs.

xG Efficiency

Actual goals were compared with modelled expected goals to provide additional performance context.

Predictive Modelling

A Random Forest classification model was used to investigate relationships between match features and match outcomes.

STATISTICAL TESTING

Population was not a statistically significant explanation for club performance

Pearson Correlation r = 0.124

Population vs average club PPG

p = 0.5548
Spearman Correlation ρ = 0.0546

Population vs total points

p = 0.7954

These results suggest that larger population alone was not a reliable explanation for stronger club performance in the project sample.

POWER BI REPORT

Interactive NPFL analytical reporting

The Power BI report translates the analytical work into an interactive reporting environment. Each page was designed around a specific analytical question rather than simply displaying as many metrics as possible.

Season Slicers Ranking Visuals Scatter Plots Trend Charts Matrix Heatmaps Conditional Formatting Comparative Charts Donut Charts DAX Measures Multi-page Navigation
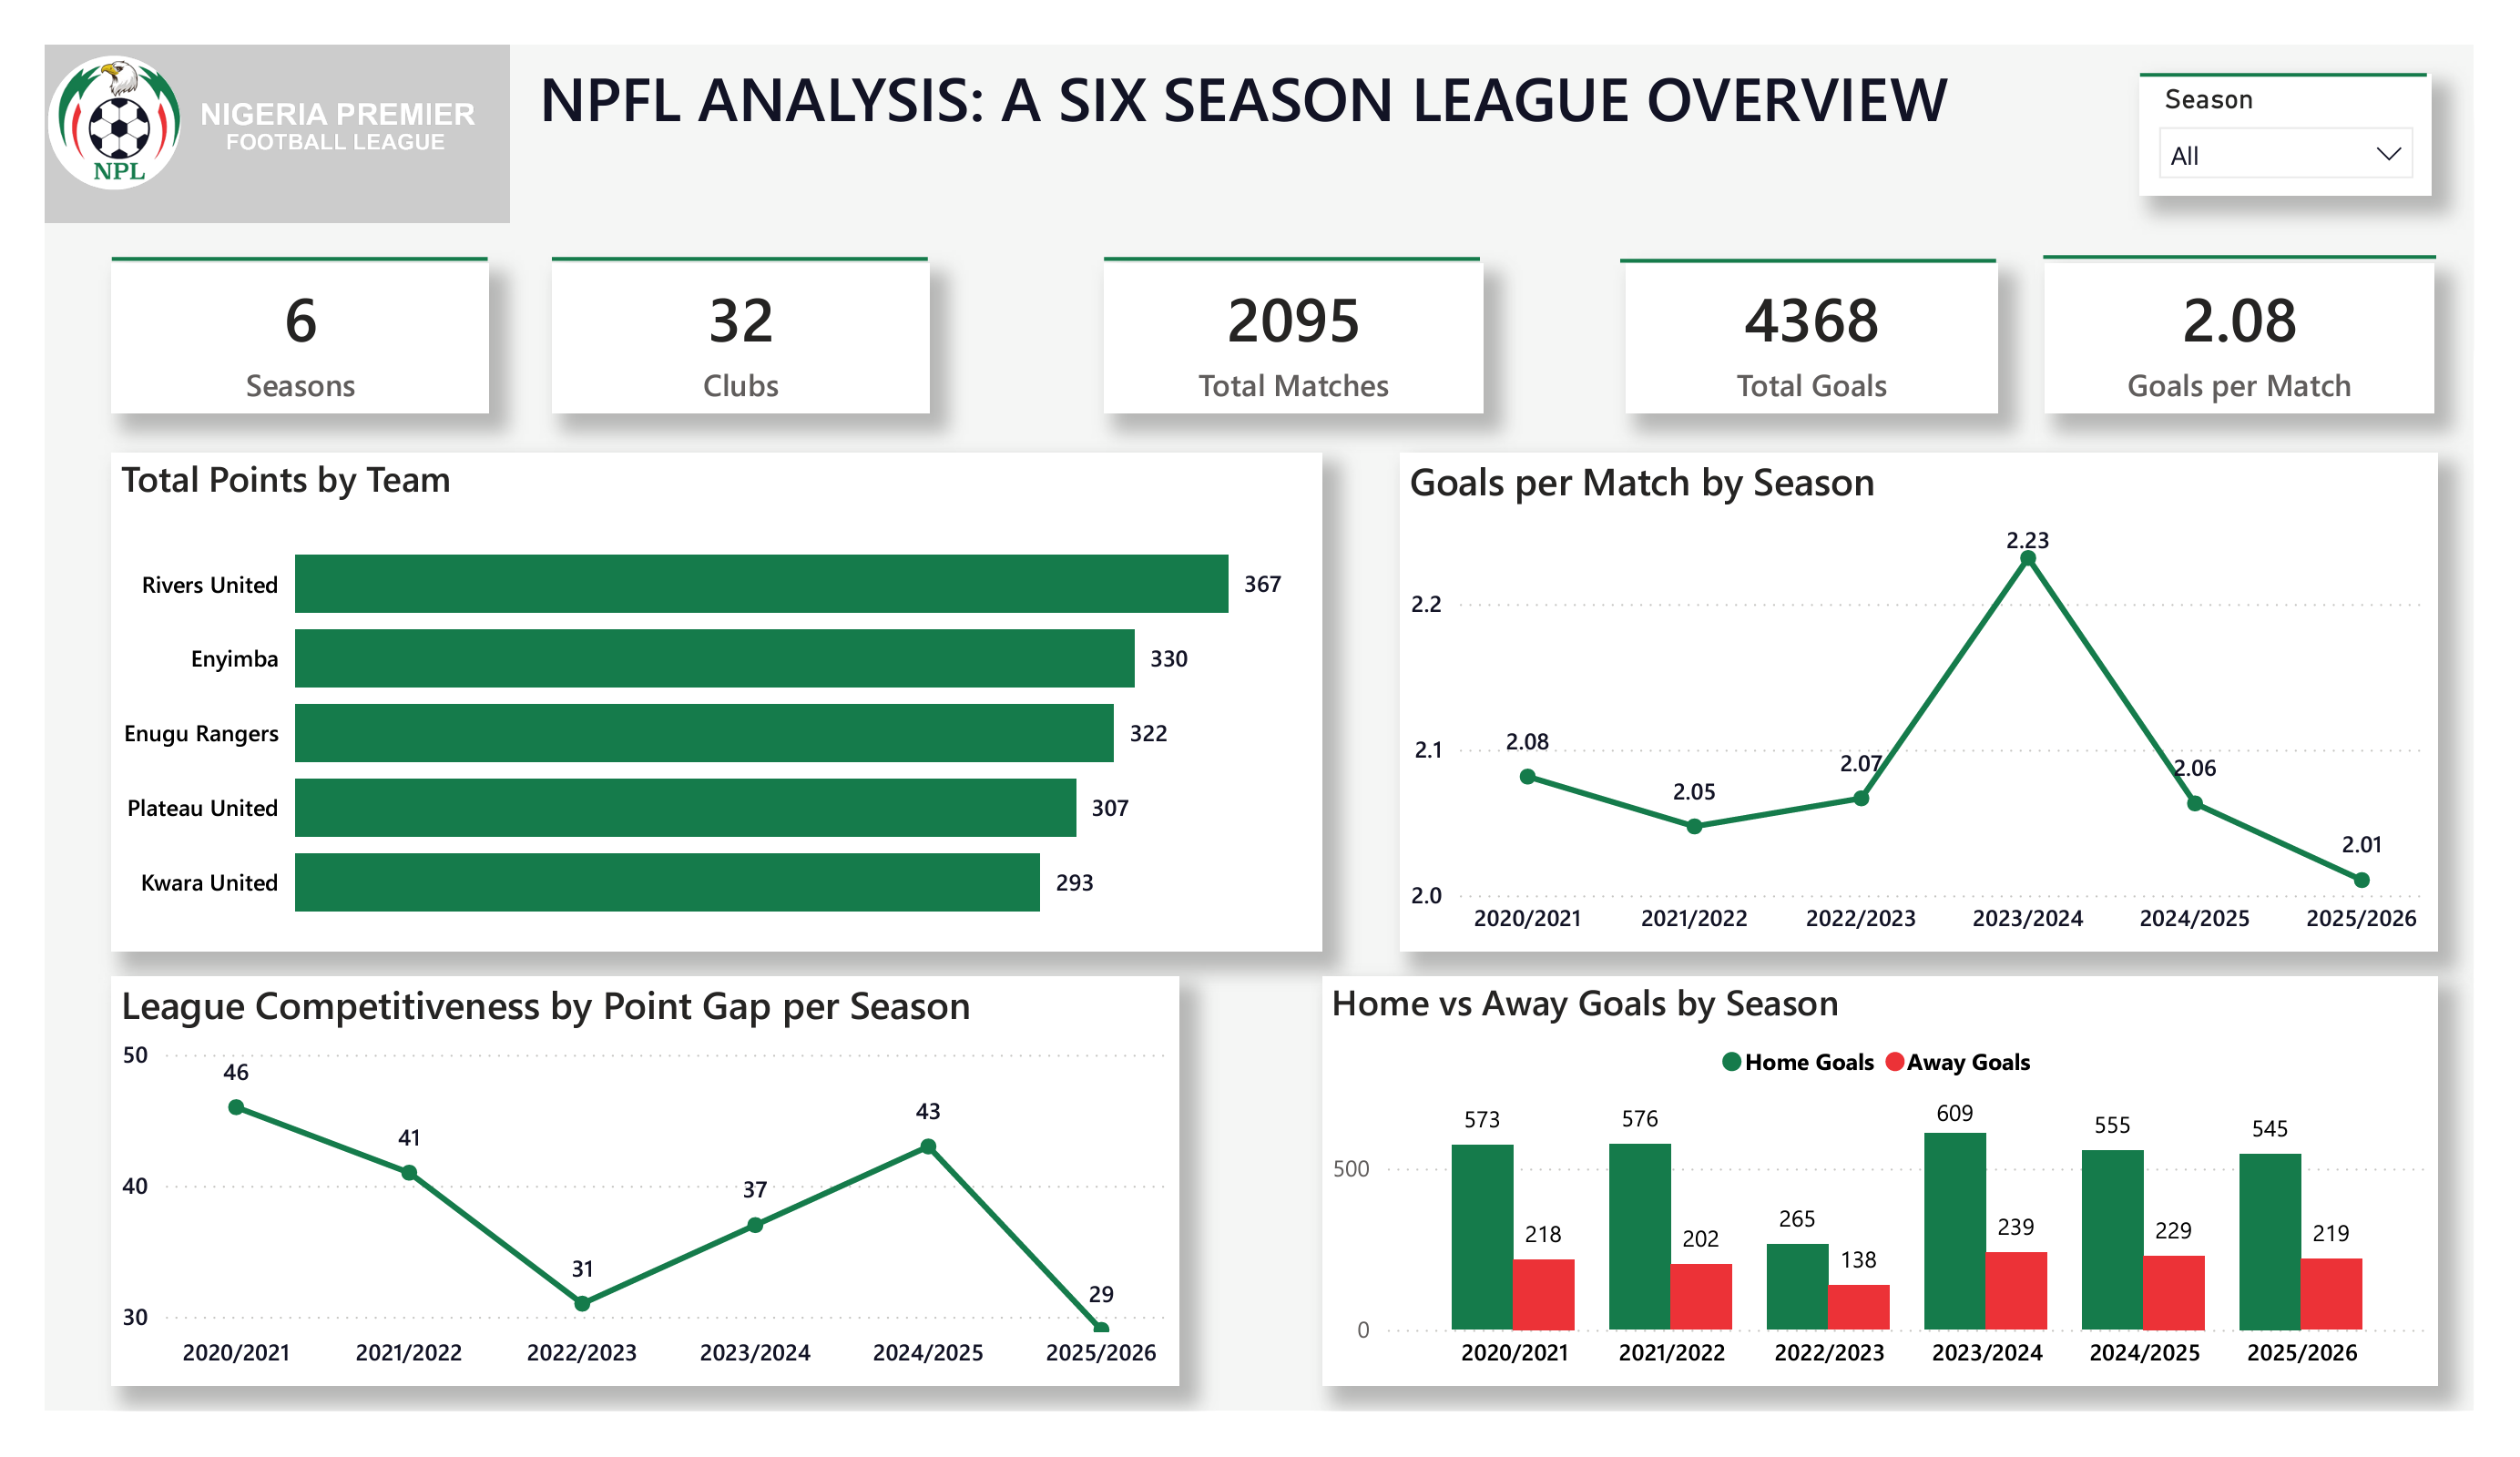
NPFL Power BI overview dashboard
01

Overview

High-level view of the NPFL dataset and key league performance indicators.

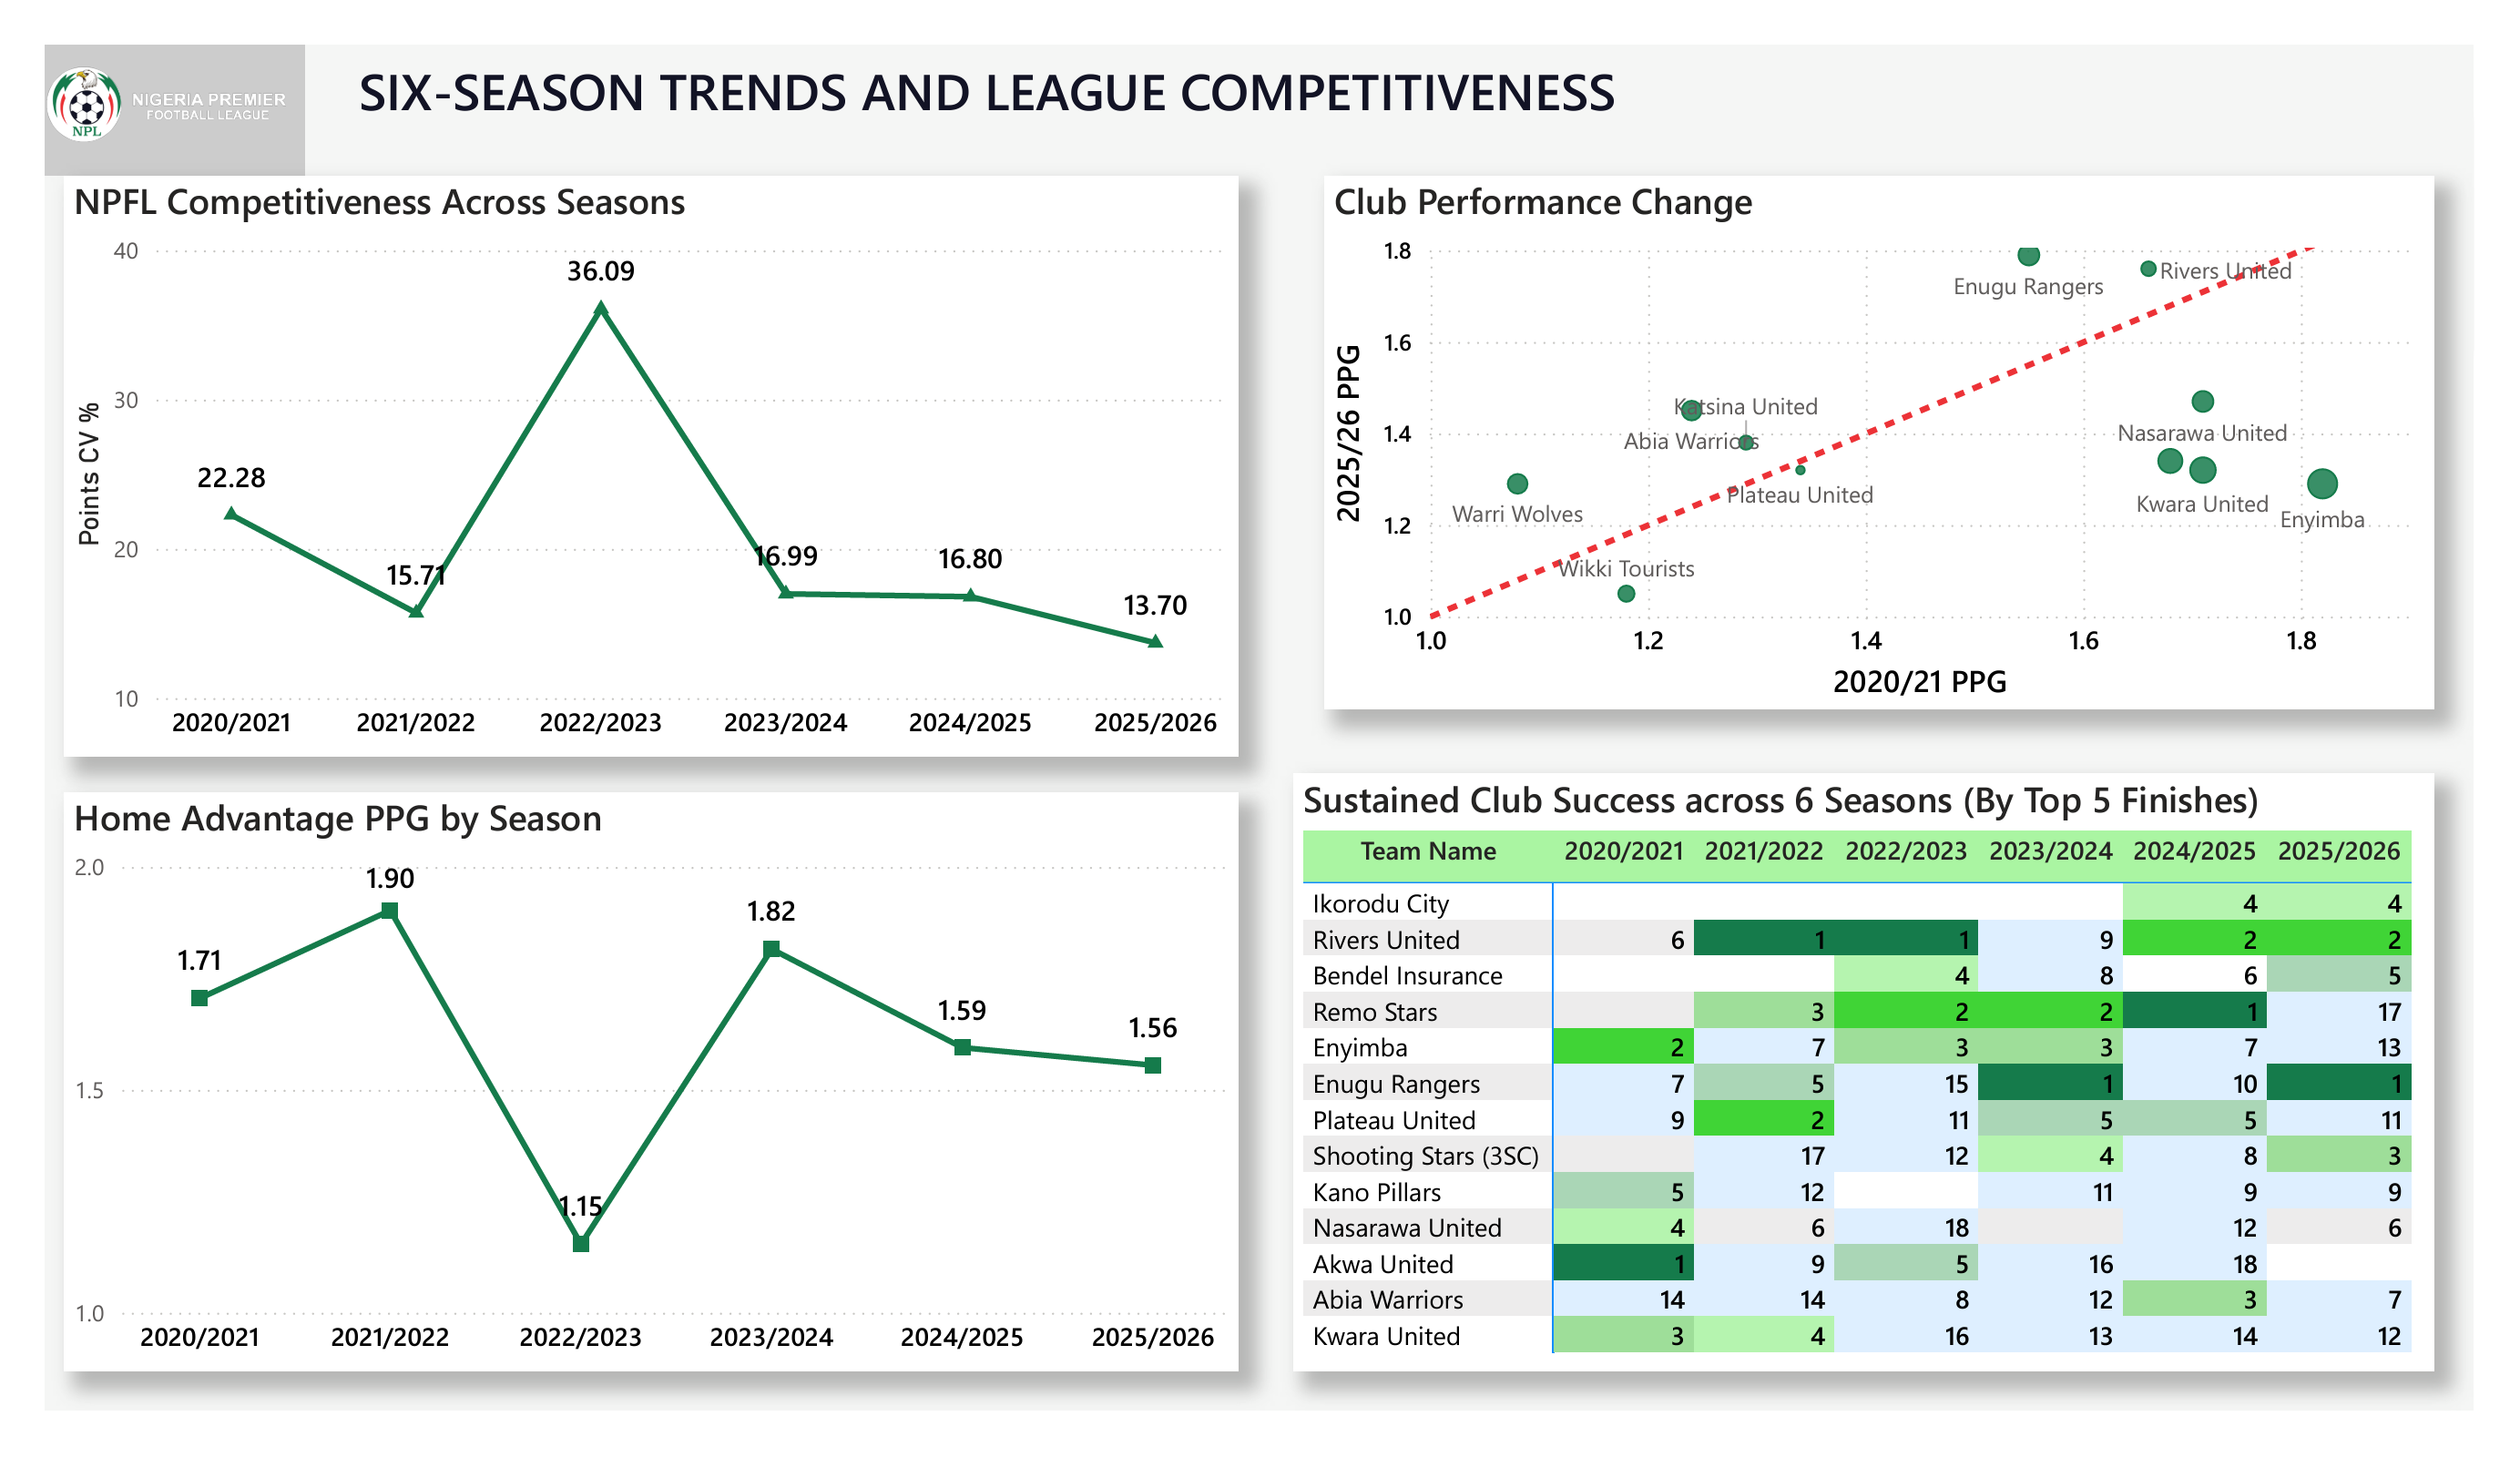
NPFL league competitiveness dashboard
02

League Competitiveness

Examining league balance, performance distribution and changes across seasons.

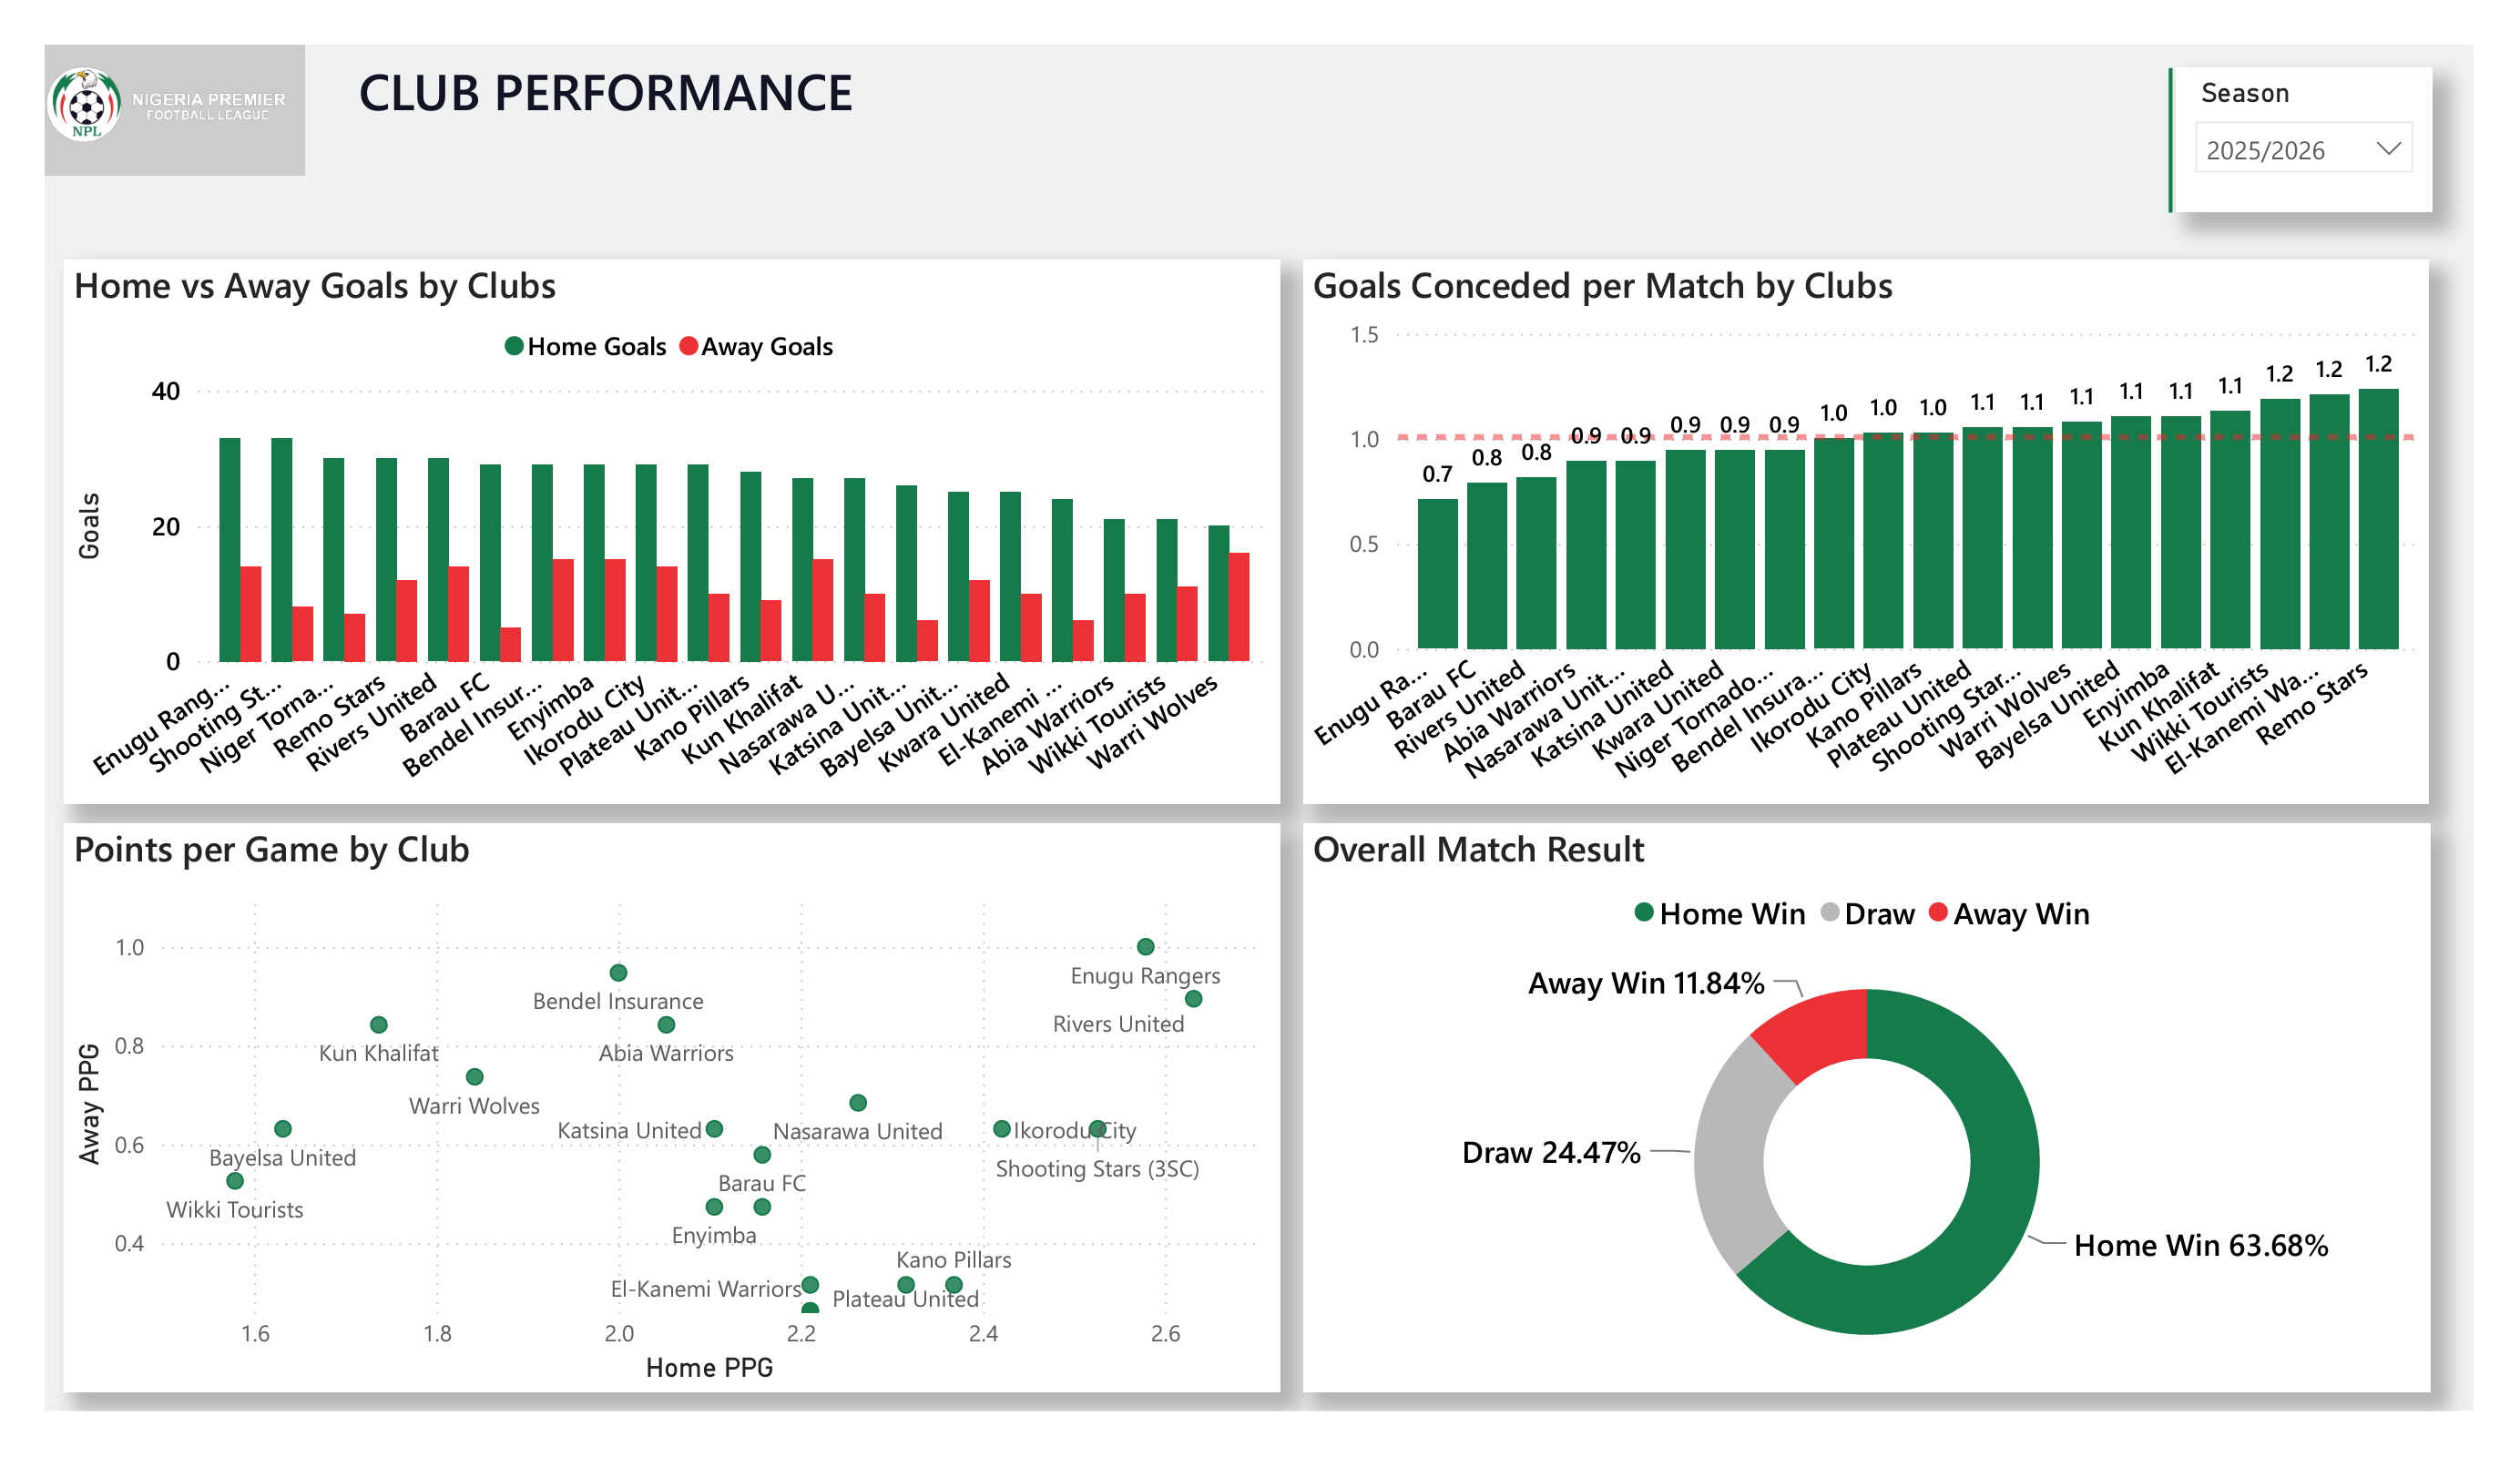
NPFL club performance dashboard
03

Club Performance

Comparing club performance, rankings, consistency and sustained success.

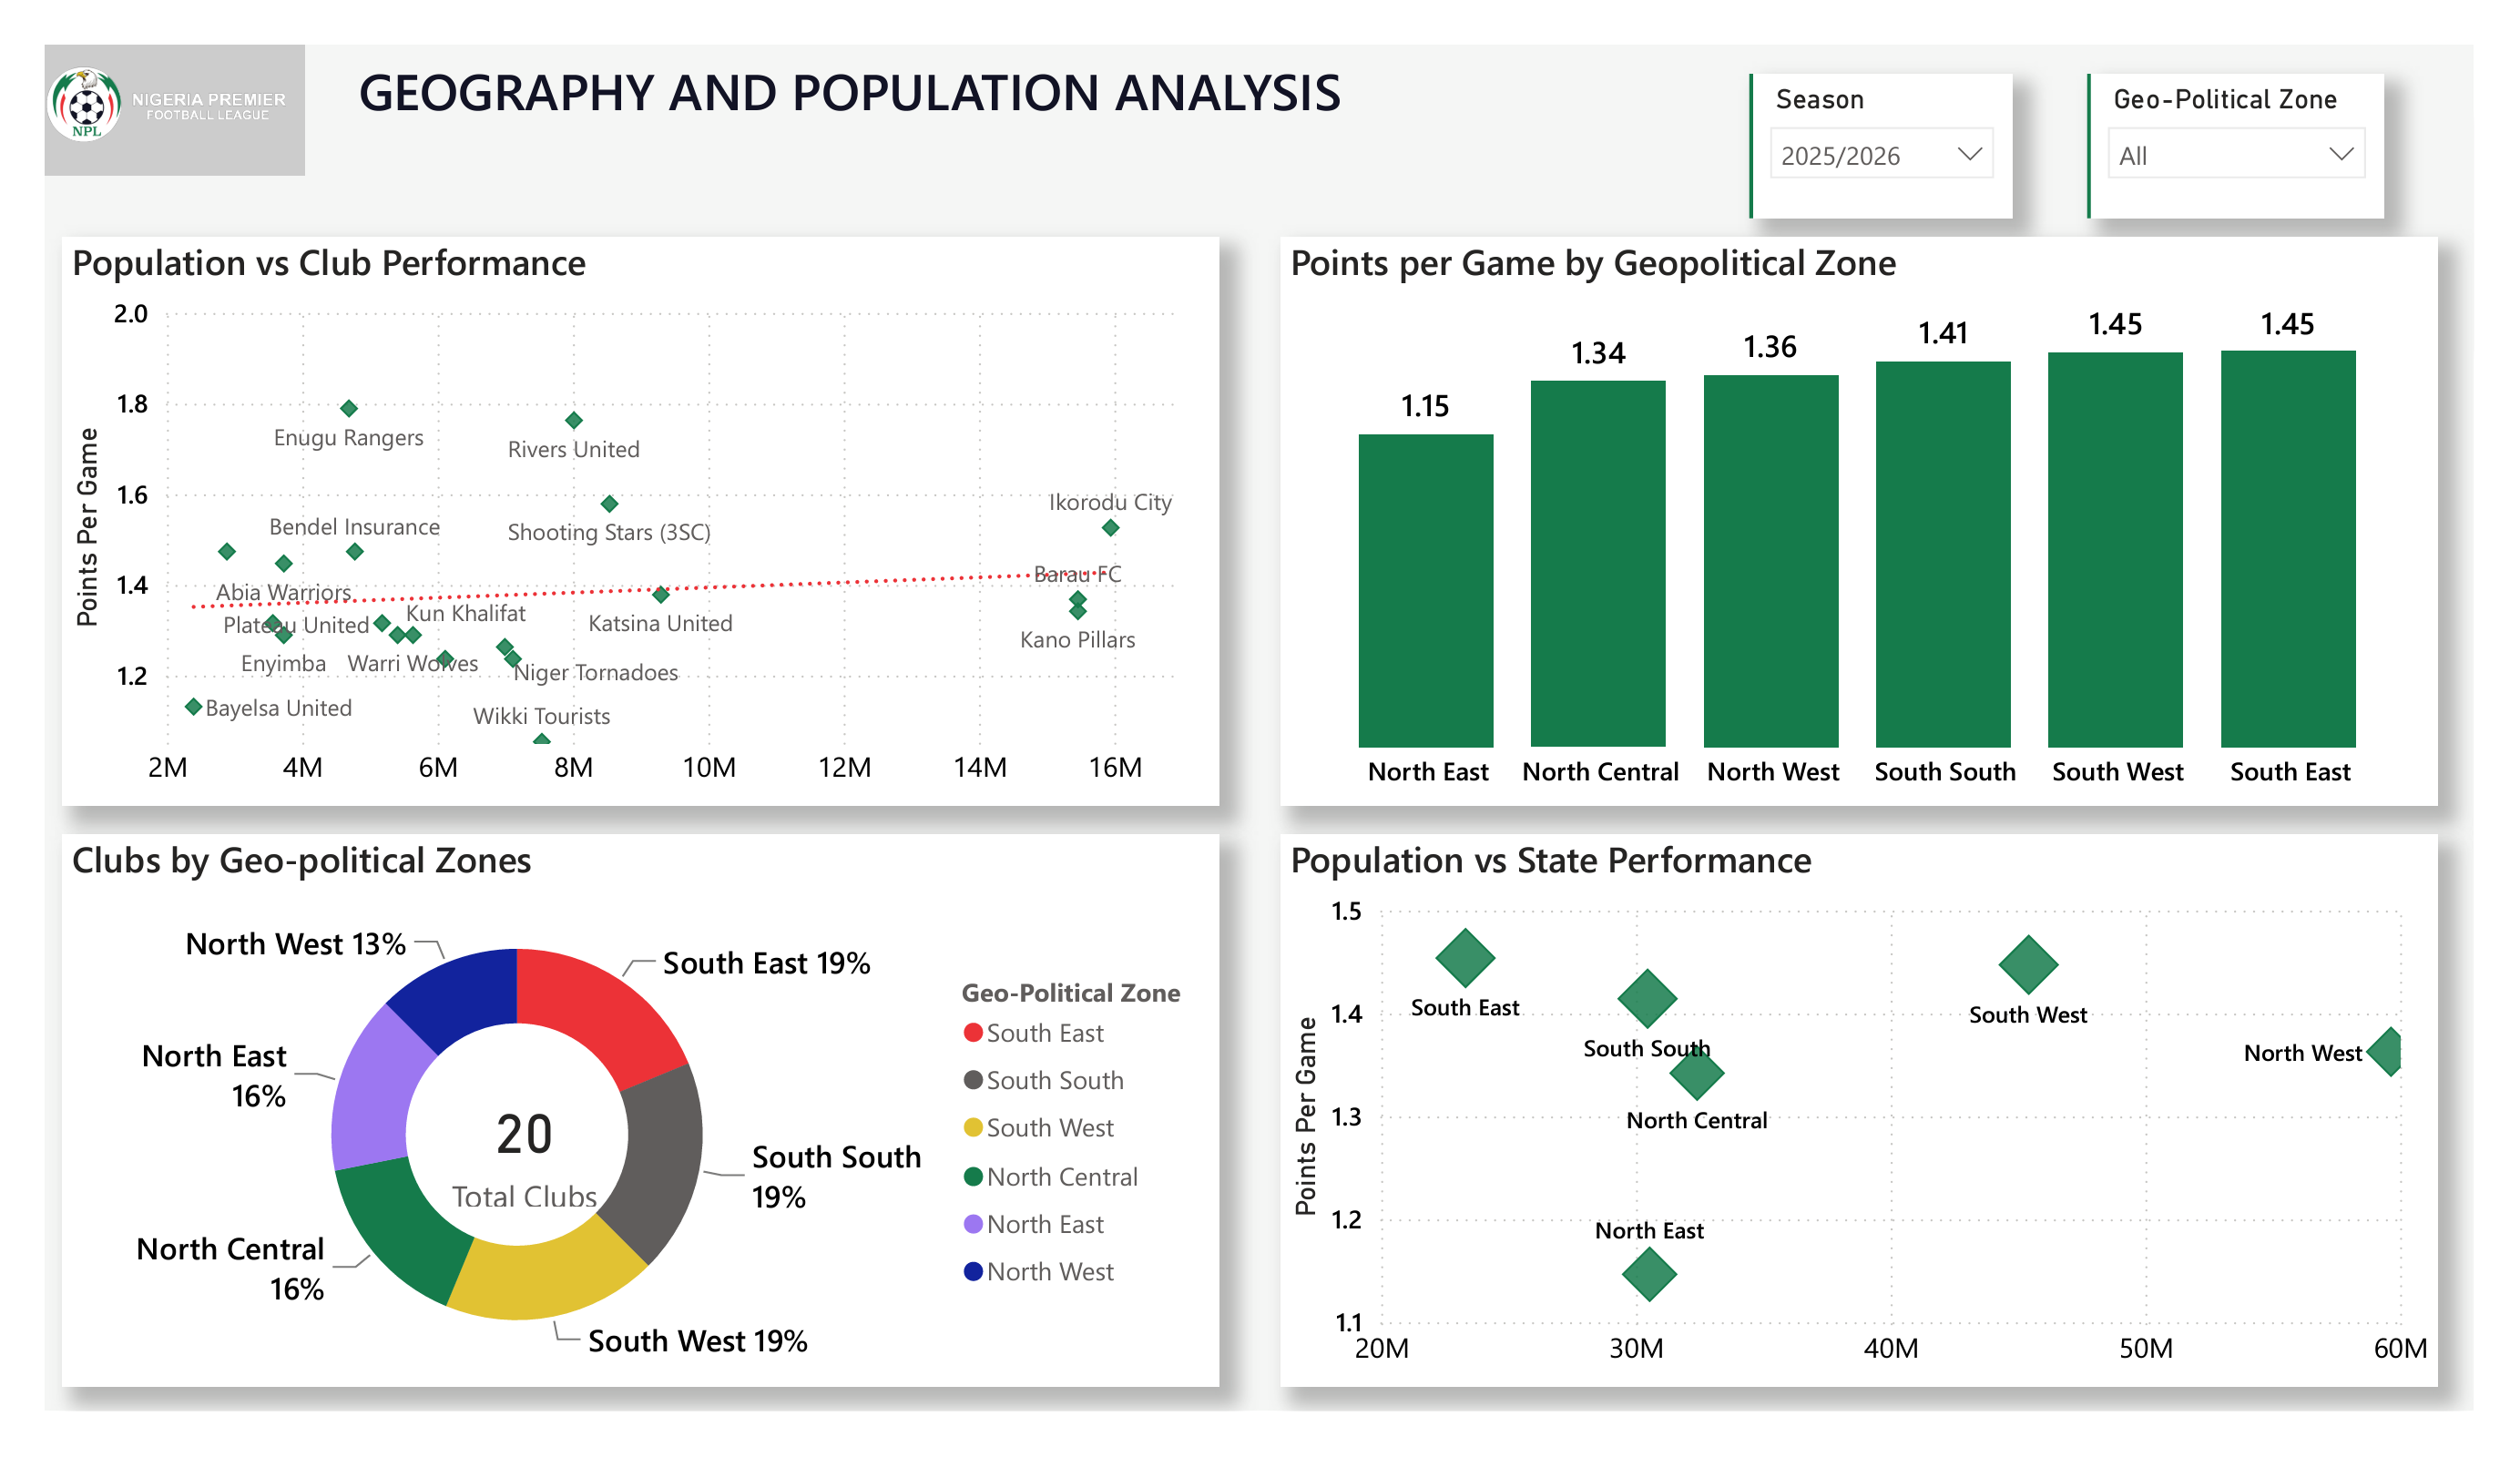
NPFL geography and population dashboard
04

Geography & Population

Exploring geographic differences and the relationship between population and football performance.

NPFL player performance dashboard
05

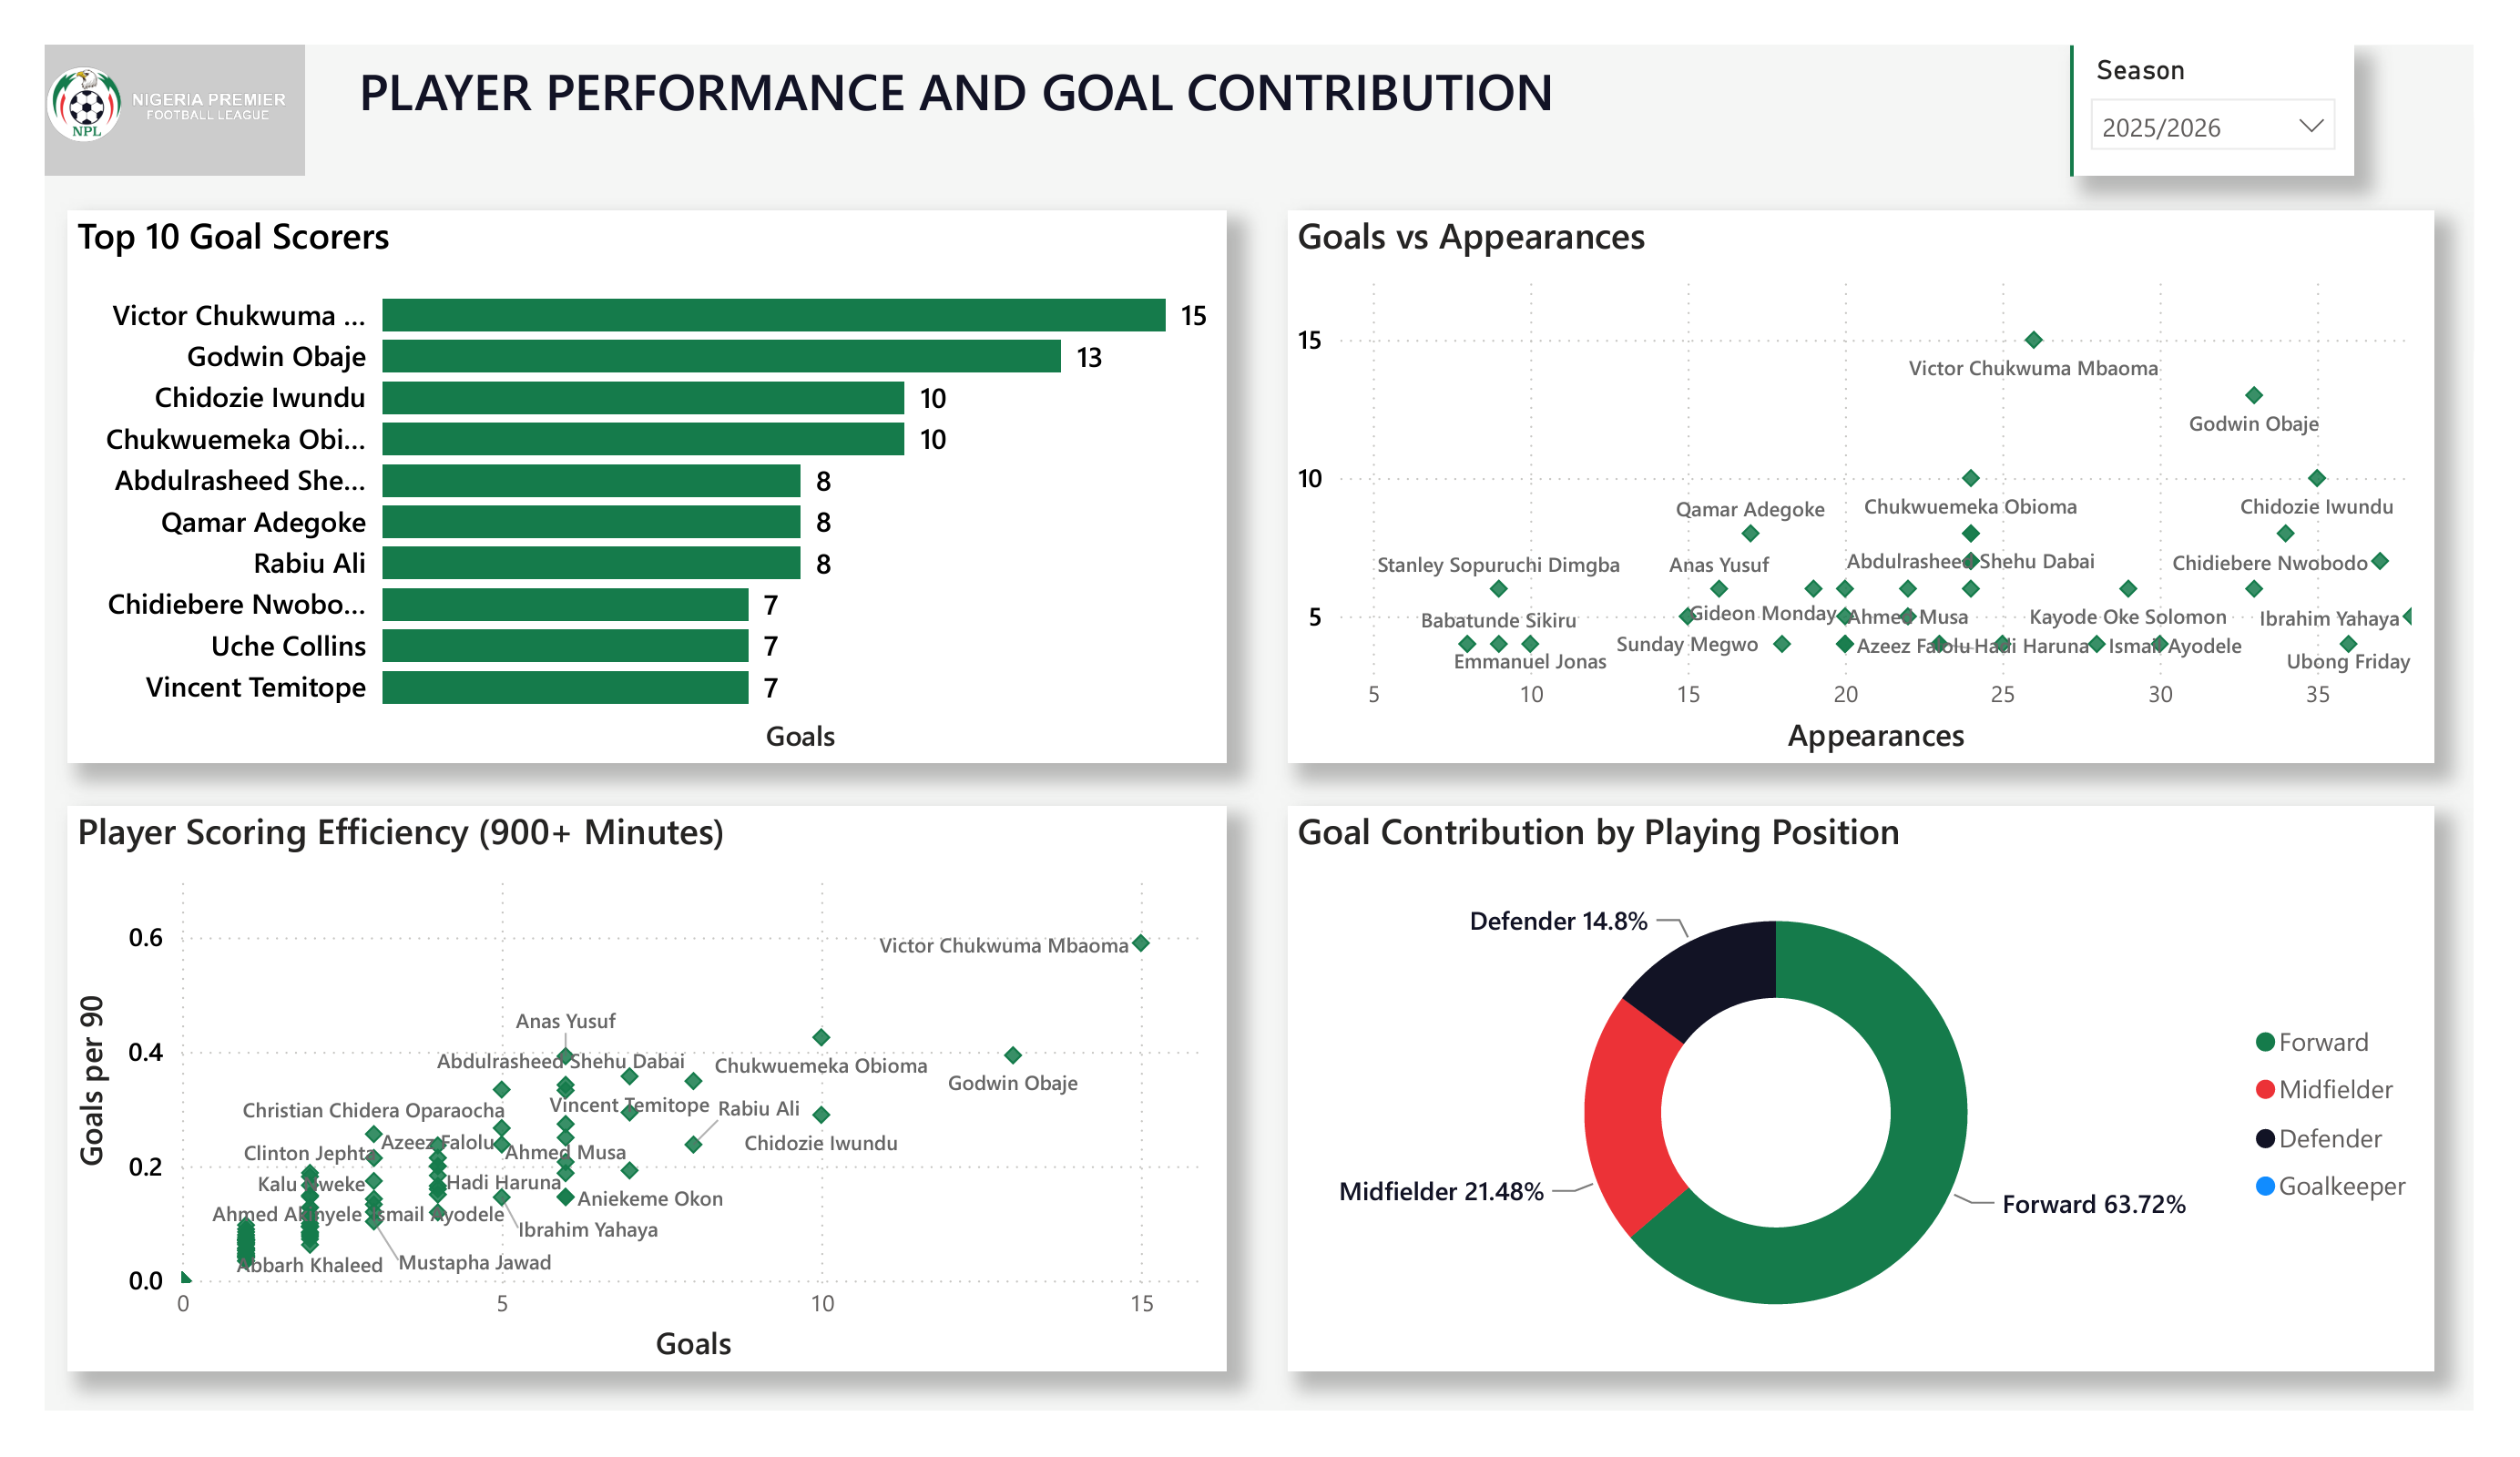
Player Performance

Analysing goals, appearances, scoring efficiency and player contribution by position.

NPFL stadium and match environment dashboard
06

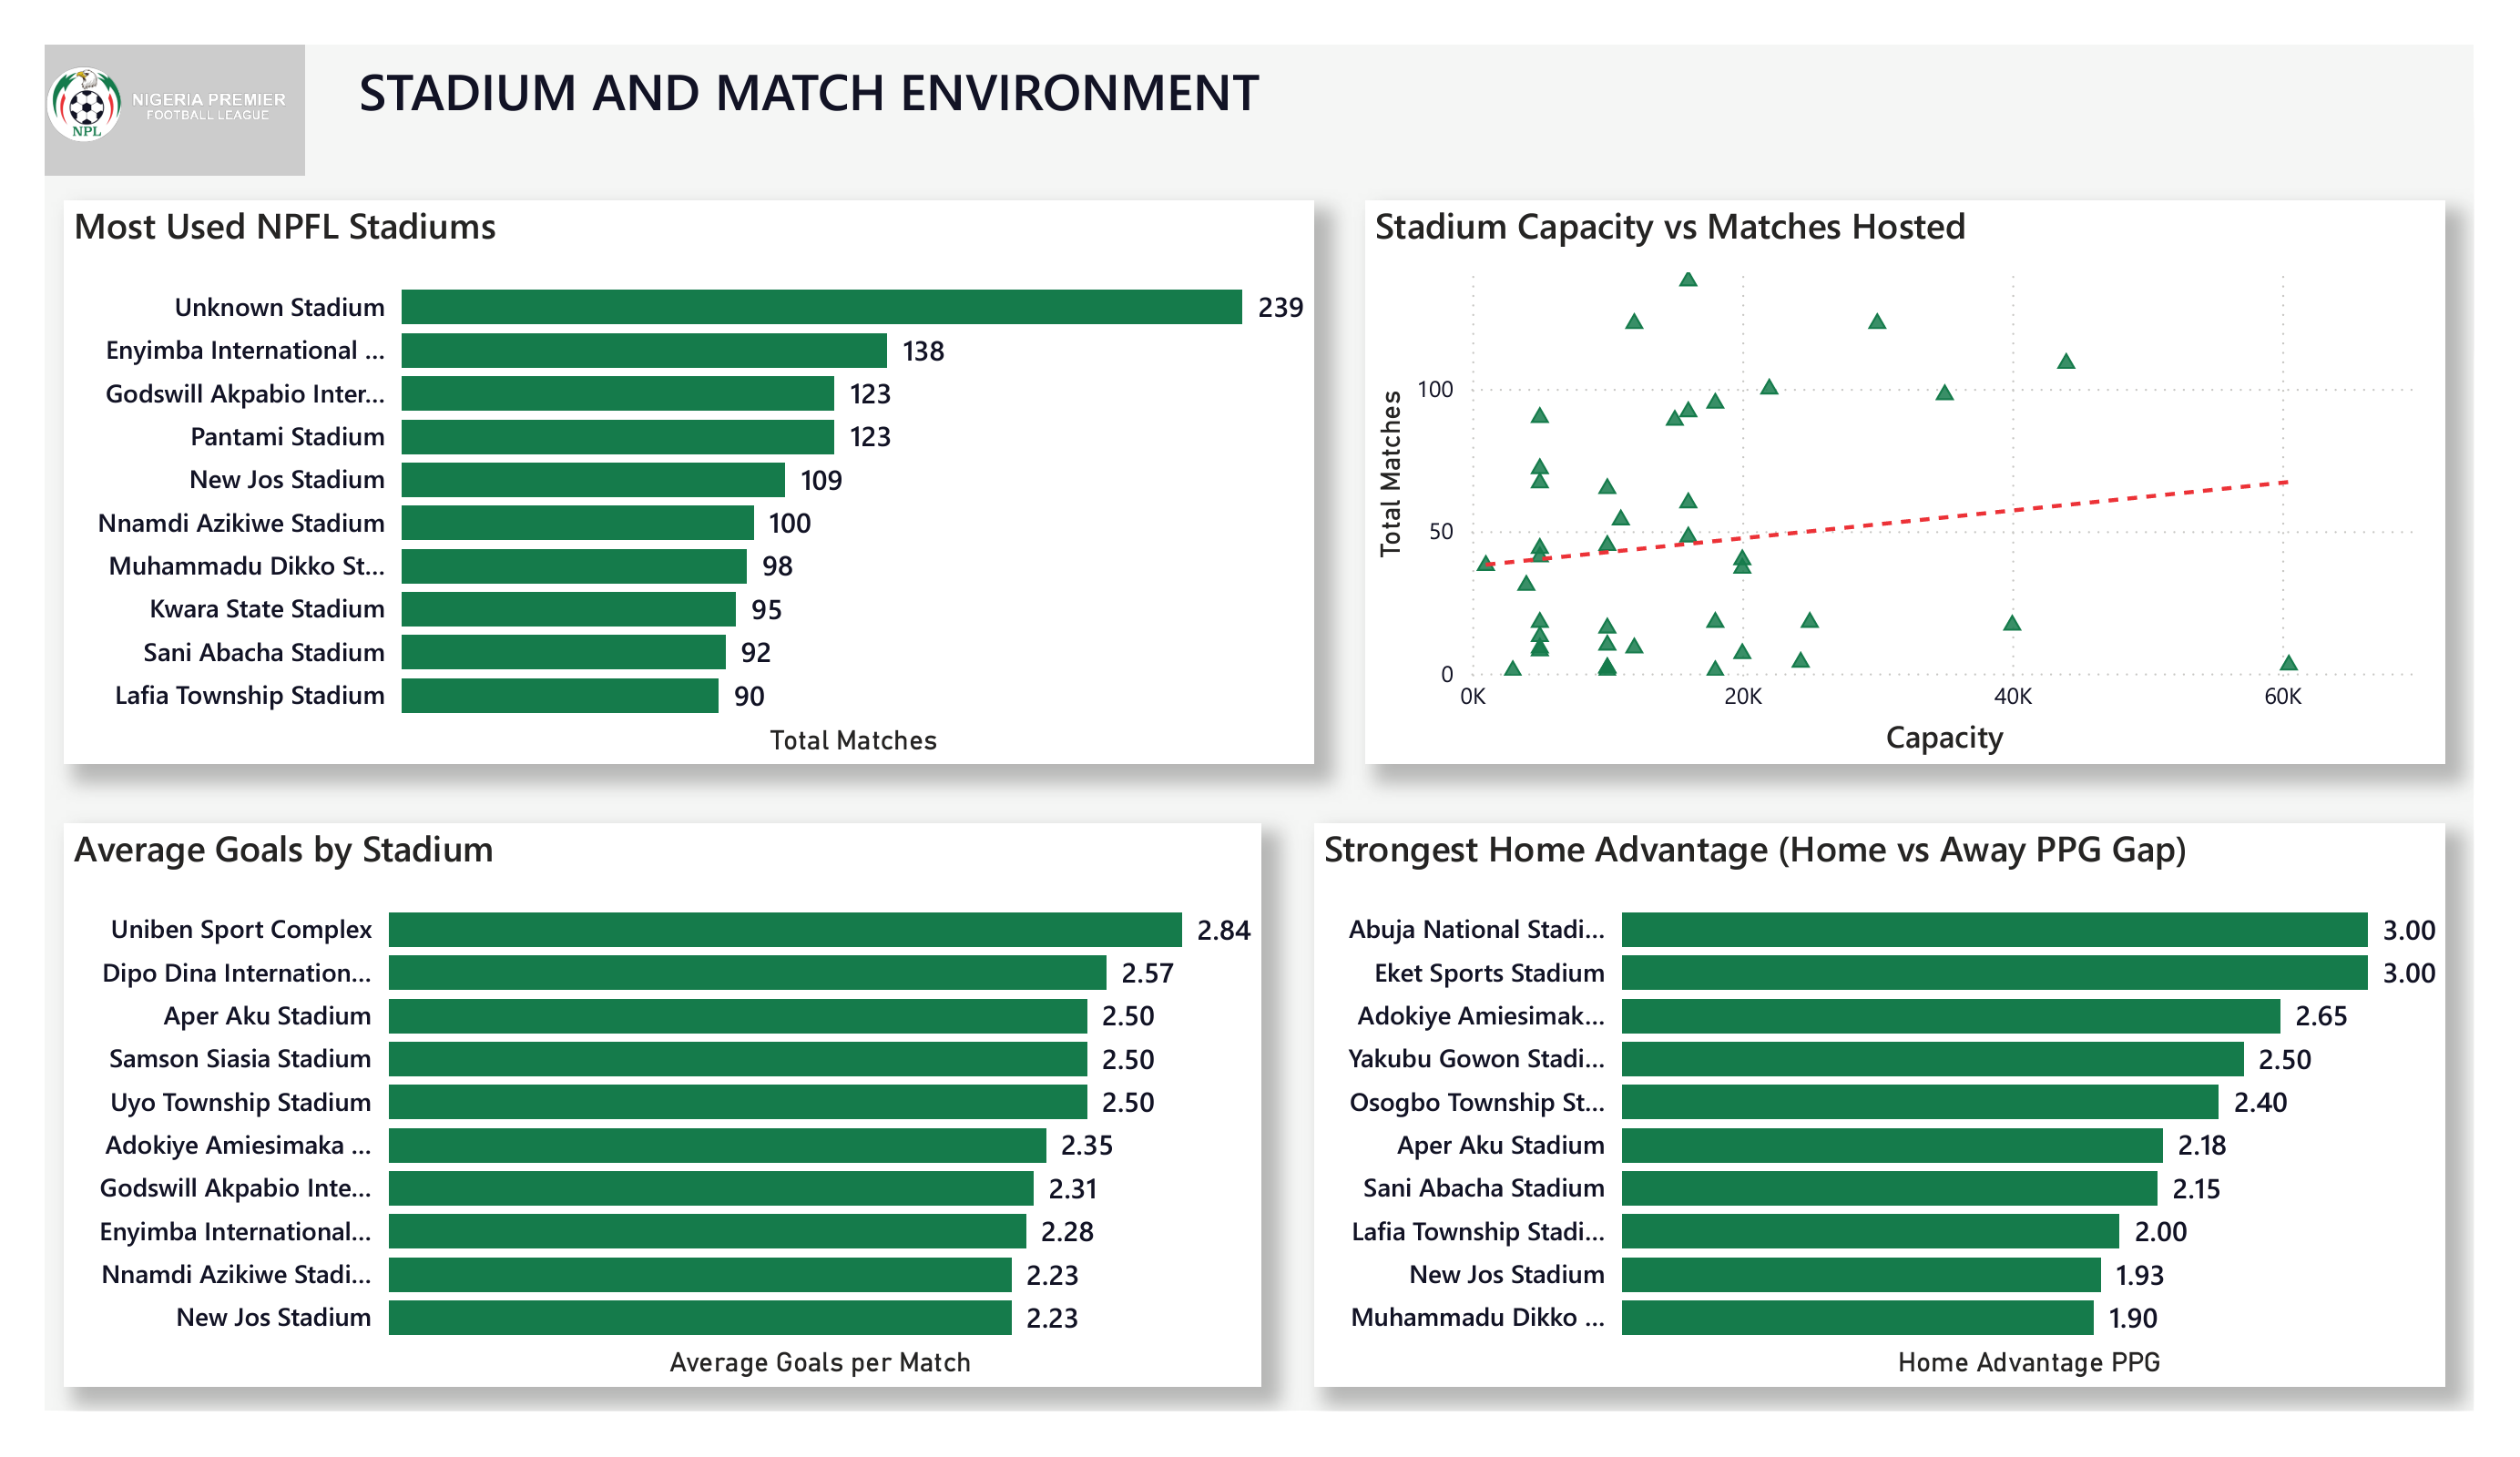
Stadium & Match Environment

Exploring stadium usage, capacity, goals and stadium-associated home advantage.

KEY FINDINGS

What the data revealed

01

Population Does Not Explain Club Performance

The analysis did not find statistically significant evidence that clubs from more populated states consistently achieve higher performance.

Population may provide a larger potential talent and supporter base, but the analysis suggests that population by itself does not determine sporting success.

02

Geography Matters, But There Is No Simple North-South Divide

Club performance varied across Nigeria's geopolitical zones, with the strongest average club PPG observed in the southern zones.

1.45 South South
1.42 South West
1.42 South East
1.15 North East
04

Sustained Success Is Concentrated

Several clubs repeatedly appeared among the strongest performers across the six-season period.

Rivers United · Enyimba · Enugu Rangers · Plateau United · Remo Stars · Kano Pillars · Abia Warriors

Rivers United recorded the highest overall points total in the project's six-season club analysis.

06

Player Goal Contribution Is Concentrated Among Forwards

In the 2025/26 player analysis, forwards accounted for almost two-thirds of recorded goal contribution.

Forward 63.72%
Midfielder 21.48%
Defender 14.80%
07

xG Efficiency Provides Useful Context

Some clubs recorded substantially more goals than their modelled expected goals, while others recorded less.

The highest actual-goals-to-xG ratios included El-Kanemi Warriors, Kano Pillars, Katsina United, Enugu Rangers and Kun Khalifat.

Actual goals versus xG is treated as an efficiency indicator rather than definitive proof of finishing skill.

08

Stadiums Are Part of the League Product

Stadium analysis examined match usage, capacity, average goals and home/away performance.

Among the most-used venues were Enyimba International Stadium, Godswill Akpabio International Stadium, Pantami Stadium, New Jos Stadium and Nnamdi Azikiwe Stadium.

09

Predictive Modelling Shows Strong Home-Win Recognition

64.9% approximate overall accuracy

The Random Forest model demonstrated useful predictive information in historical team-performance variables.

However, substantial class imbalance meant that the model strongly favoured home wins and performed poorly when identifying draws and away wins.

STRATEGIC IMPLICATIONS

What could these findings mean for the NPFL?

01

Develop Sporting Systems

Population alone does not appear to determine club performance. Investment should therefore focus on systems capable of converting Nigeria's large football talent pool into sustained sporting performance.

Academies Coaching Recruitment Performance Analysis
02

Strengthen Infrastructure

Improving pitch quality, stadium facilities, supporter experience, accessibility and broadcast infrastructure could strengthen both sporting and commercial outcomes.

03

Expand Football Data Infrastructure

A stronger NPFL data ecosystem could support performance analysis, recruitment, scouting, broadcast storytelling, fan engagement and commercial analytics.

04

Improve Broadcast & Digital Reach

Better broadcast coverage, digital content and consistent data collection can increase the league's visibility among supporters, sponsors, broadcasters, scouts and clubs.

05

Build Commercial Value Around the Sporting Product

A stronger domestic football ecosystem can connect sporting performance with fan engagement, digital reach, commercial partnerships and long-term investment.

Sporting Performance
↓
Fan Engagement
↓
Broadcast & Digital Reach
↓
Commercial Partnerships
↓
Club & League Investment
↓
Improved Sporting Ecosystem

DATA QUALITY & LIMITATIONS

Reading the analysis with context

Abridged 2022/23 Season

The 2022/23 season contains fewer matches, making direct comparison of some season-level totals inappropriate without considering season structure.

Duplicate Player Records

Duplicate player records were identified during preparation and handled where appropriate.

Missing Stadium Information

Some match records contain missing or unknown stadium information.

Geographic Mapping

Geographic analysis depends on the quality and consistency of state and club mapping.

Advanced Player Statistics

Some advanced player statistics are incomplete across the full analysis period.

xG Model Limitations

Expected-goals metrics depend on the underlying model and should be interpreted as modelled estimates.

Predictive Model Class Imbalance

Overall accuracy alone is not an adequate measure of model quality because the outcome classes were substantially imbalanced.

Causality

The project is primarily observational. Identified relationships should not automatically be interpreted as causal relationships.

TECHNICAL SKILLS

Tools & techniques demonstrated

SQL

SQL Server Data Warehousing Dimensional Modelling Star Schema Staging Tables BULK INSERT TRY_CAST Data Validation Relational Modelling

Python

Pandas NumPy EDA Data Cleaning Feature Engineering Statistical Analysis Pearson Correlation Spearman Correlation xG Analysis Random Forest Model Evaluation

Power BI

Data Modelling DAX Filter Context Measures Ranking Logic Season-aware Calculations Conditional Formatting Scatter Plots Matrix Heatmaps Tooltips Interactive Filtering

OVERALL CONCLUSION

Population isn't the limiting factor.

The analysis produces a more nuanced picture of the NPFL than a simple population-versus-performance comparison.

Nigeria has a large population, deep football culture and a strong history of football achievement. However, the analysis does not show population size alone translating directly into club performance.

Instead, the strongest patterns are found in sustained club performance, home advantage, competitive balance, player contribution, geographic differences, stadium environments, data availability and sporting systems.

The reduction in PPG variation across the six-season period suggests that the league became more competitively balanced toward 2025/26, while repeated high performance among certain clubs shows that sustained success remains achievable for clubs capable of maintaining strong systems.

Nigeria has the football talent and culture; the data suggests population isn't the limiting factor — the bigger opportunity is building the sporting, infrastructure, data, broadcast and commercial systems that convert that potential into sustained domestic value.

DATA SOURCE & LICENSING

About the underlying data

The football datasets used in this project were obtained through a paid FootyStats subscription.

The underlying source datasets are not included in the public repository. Original CSV files, cleaned versions that substantially reproduce the licensed source data, database backups and full database dumps are intentionally excluded.

The project instead focuses on demonstrating analytical methodology, SQL engineering, statistical analysis, data modelling, Power BI development, DAX calculations, visualisation, analytical storytelling, findings and recommendations.

Disclaimer

This project is an independent data-analysis portfolio project. The analysis is intended for educational, analytical and portfolio purposes and does not represent an official publication by the Nigerian Premier Football League, any NPFL club, FootyStats or any other data provider.

Statistical relationships and model outputs should be interpreted within the limitations described in this project.