DATA ANALYTICS PROJECT

Health Inequality in Nigeria: A Child Nutrition Analysis

An end-to-end data analytics project analyzing child nutrition inequalities in Nigeria using WHO Global Health Observatory data. The project explores how wealth, educational attainment, and place of residence influence childhood nutrition outcomes through SQL analysis and an interactive Power BI dashboard.

Project Overview

Child malnutrition is a major public health challenge in Nigeria. However, national averages can hide significant differences between socioeconomic groups.

This project examines childhood nutrition outcomes across three major indicators:

  • Stunting
  • Underweight
  • Wasting

The analysis focuses on three dimensions of inequality: household wealth, educational attainment, and place of residence.

The objective was to transform raw WHO health data into meaningful insights that could support evidence-based decision-making.
Business Problem

The analysis was designed to answer several key questions.

01

Which socioeconomic factor has the strongest association with child malnutrition?

02

How large are nutrition disparities between the poorest and richest households?

03

Does educational attainment influence nutrition outcomes?

04

Are rural communities disproportionately affected?

Dataset

The project uses data from the WHO Global Health Observatory (GHO), focusing on Nigeria from 2018–2022.

The original dataset contained approximately 25,909 rows. After cleaning and filtering, only the relevant child nutrition indicators were retained for analysis.

Tools

  • Excel — Data auditing and validation
  • SQL Server — Data cleaning and analysis
  • Power BI — Dashboard development
  • DAX — KPI calculations and measures
  • GitHub — Documentation and version control

Analytical Workflow

01

Raw WHO Dataset

↓
02

Excel Data Audit

↓
03

SQL Data Cleaning

↓
04

Indicator Validation

↓
05

Exploratory SQL Analysis

↓
06

Power BI Dashboard

↓
07

Executive Insights & Recommendations

Key Findings

The analysis revealed clear inequalities across wealth, educational attainment, and place of residence.

01

Wealth Inequality

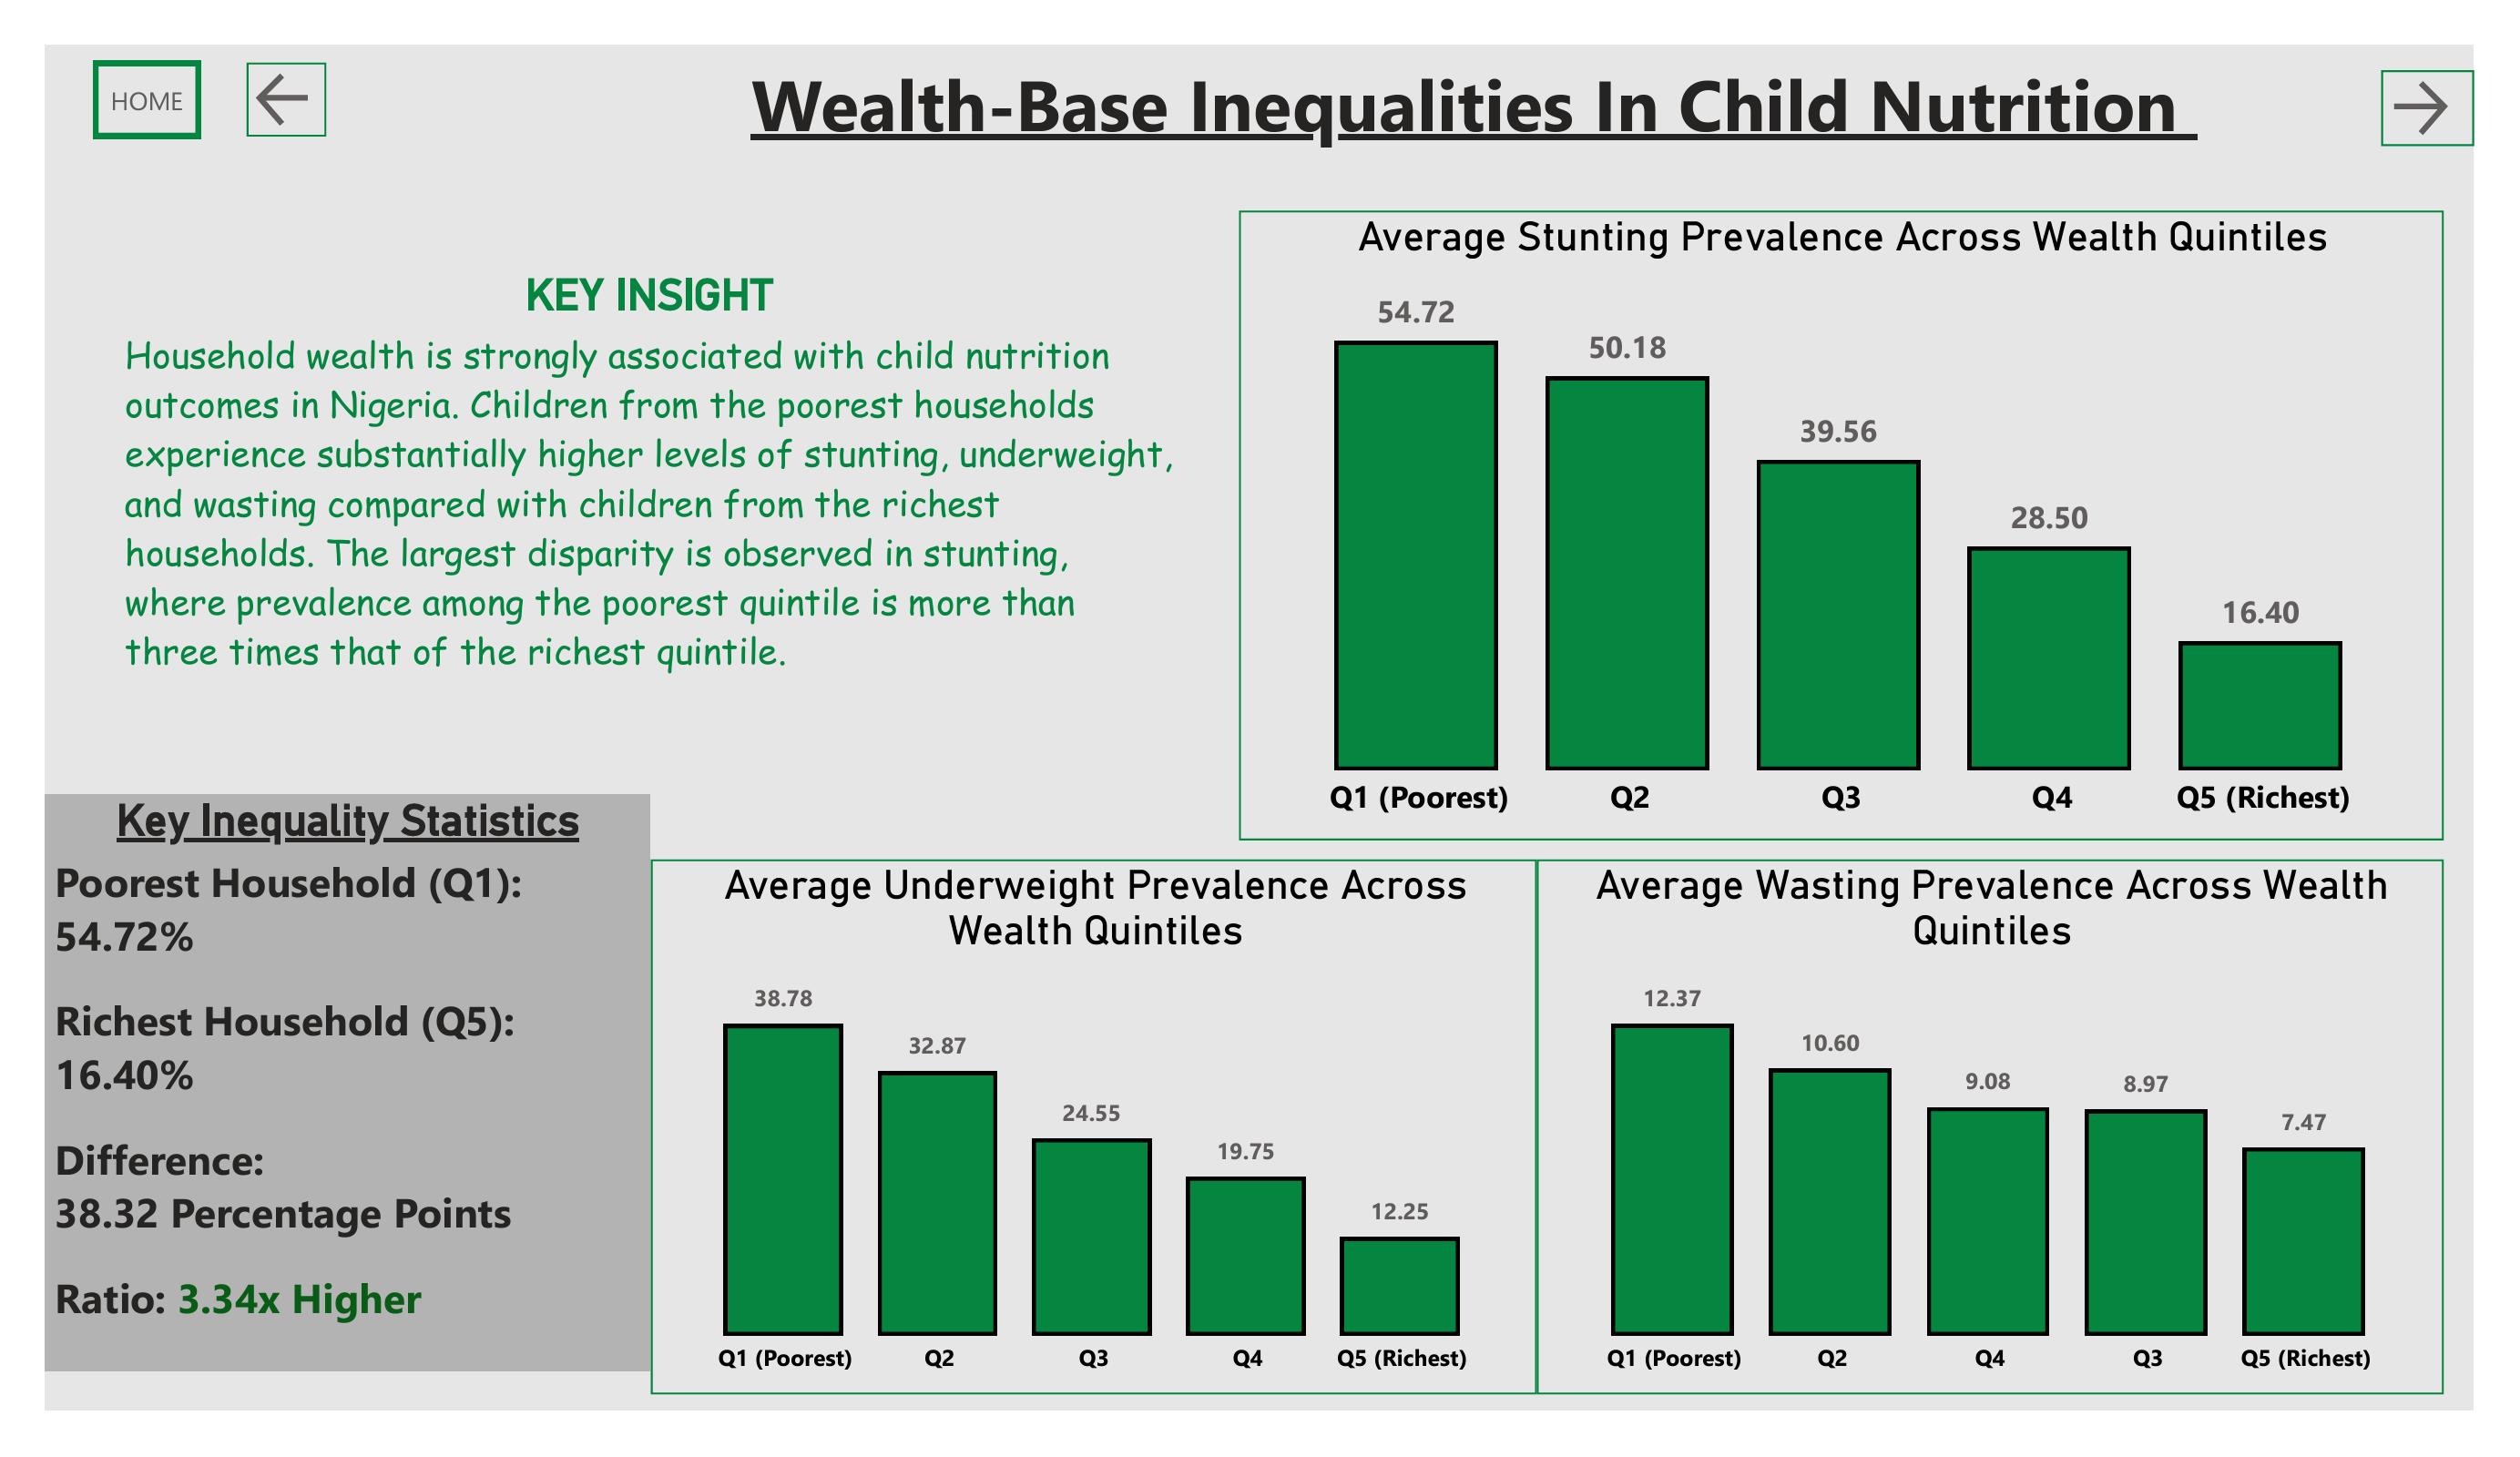
Children from the poorest households experienced stunting prevalence more than three times higher than children from the richest households.

02

Education Inequality

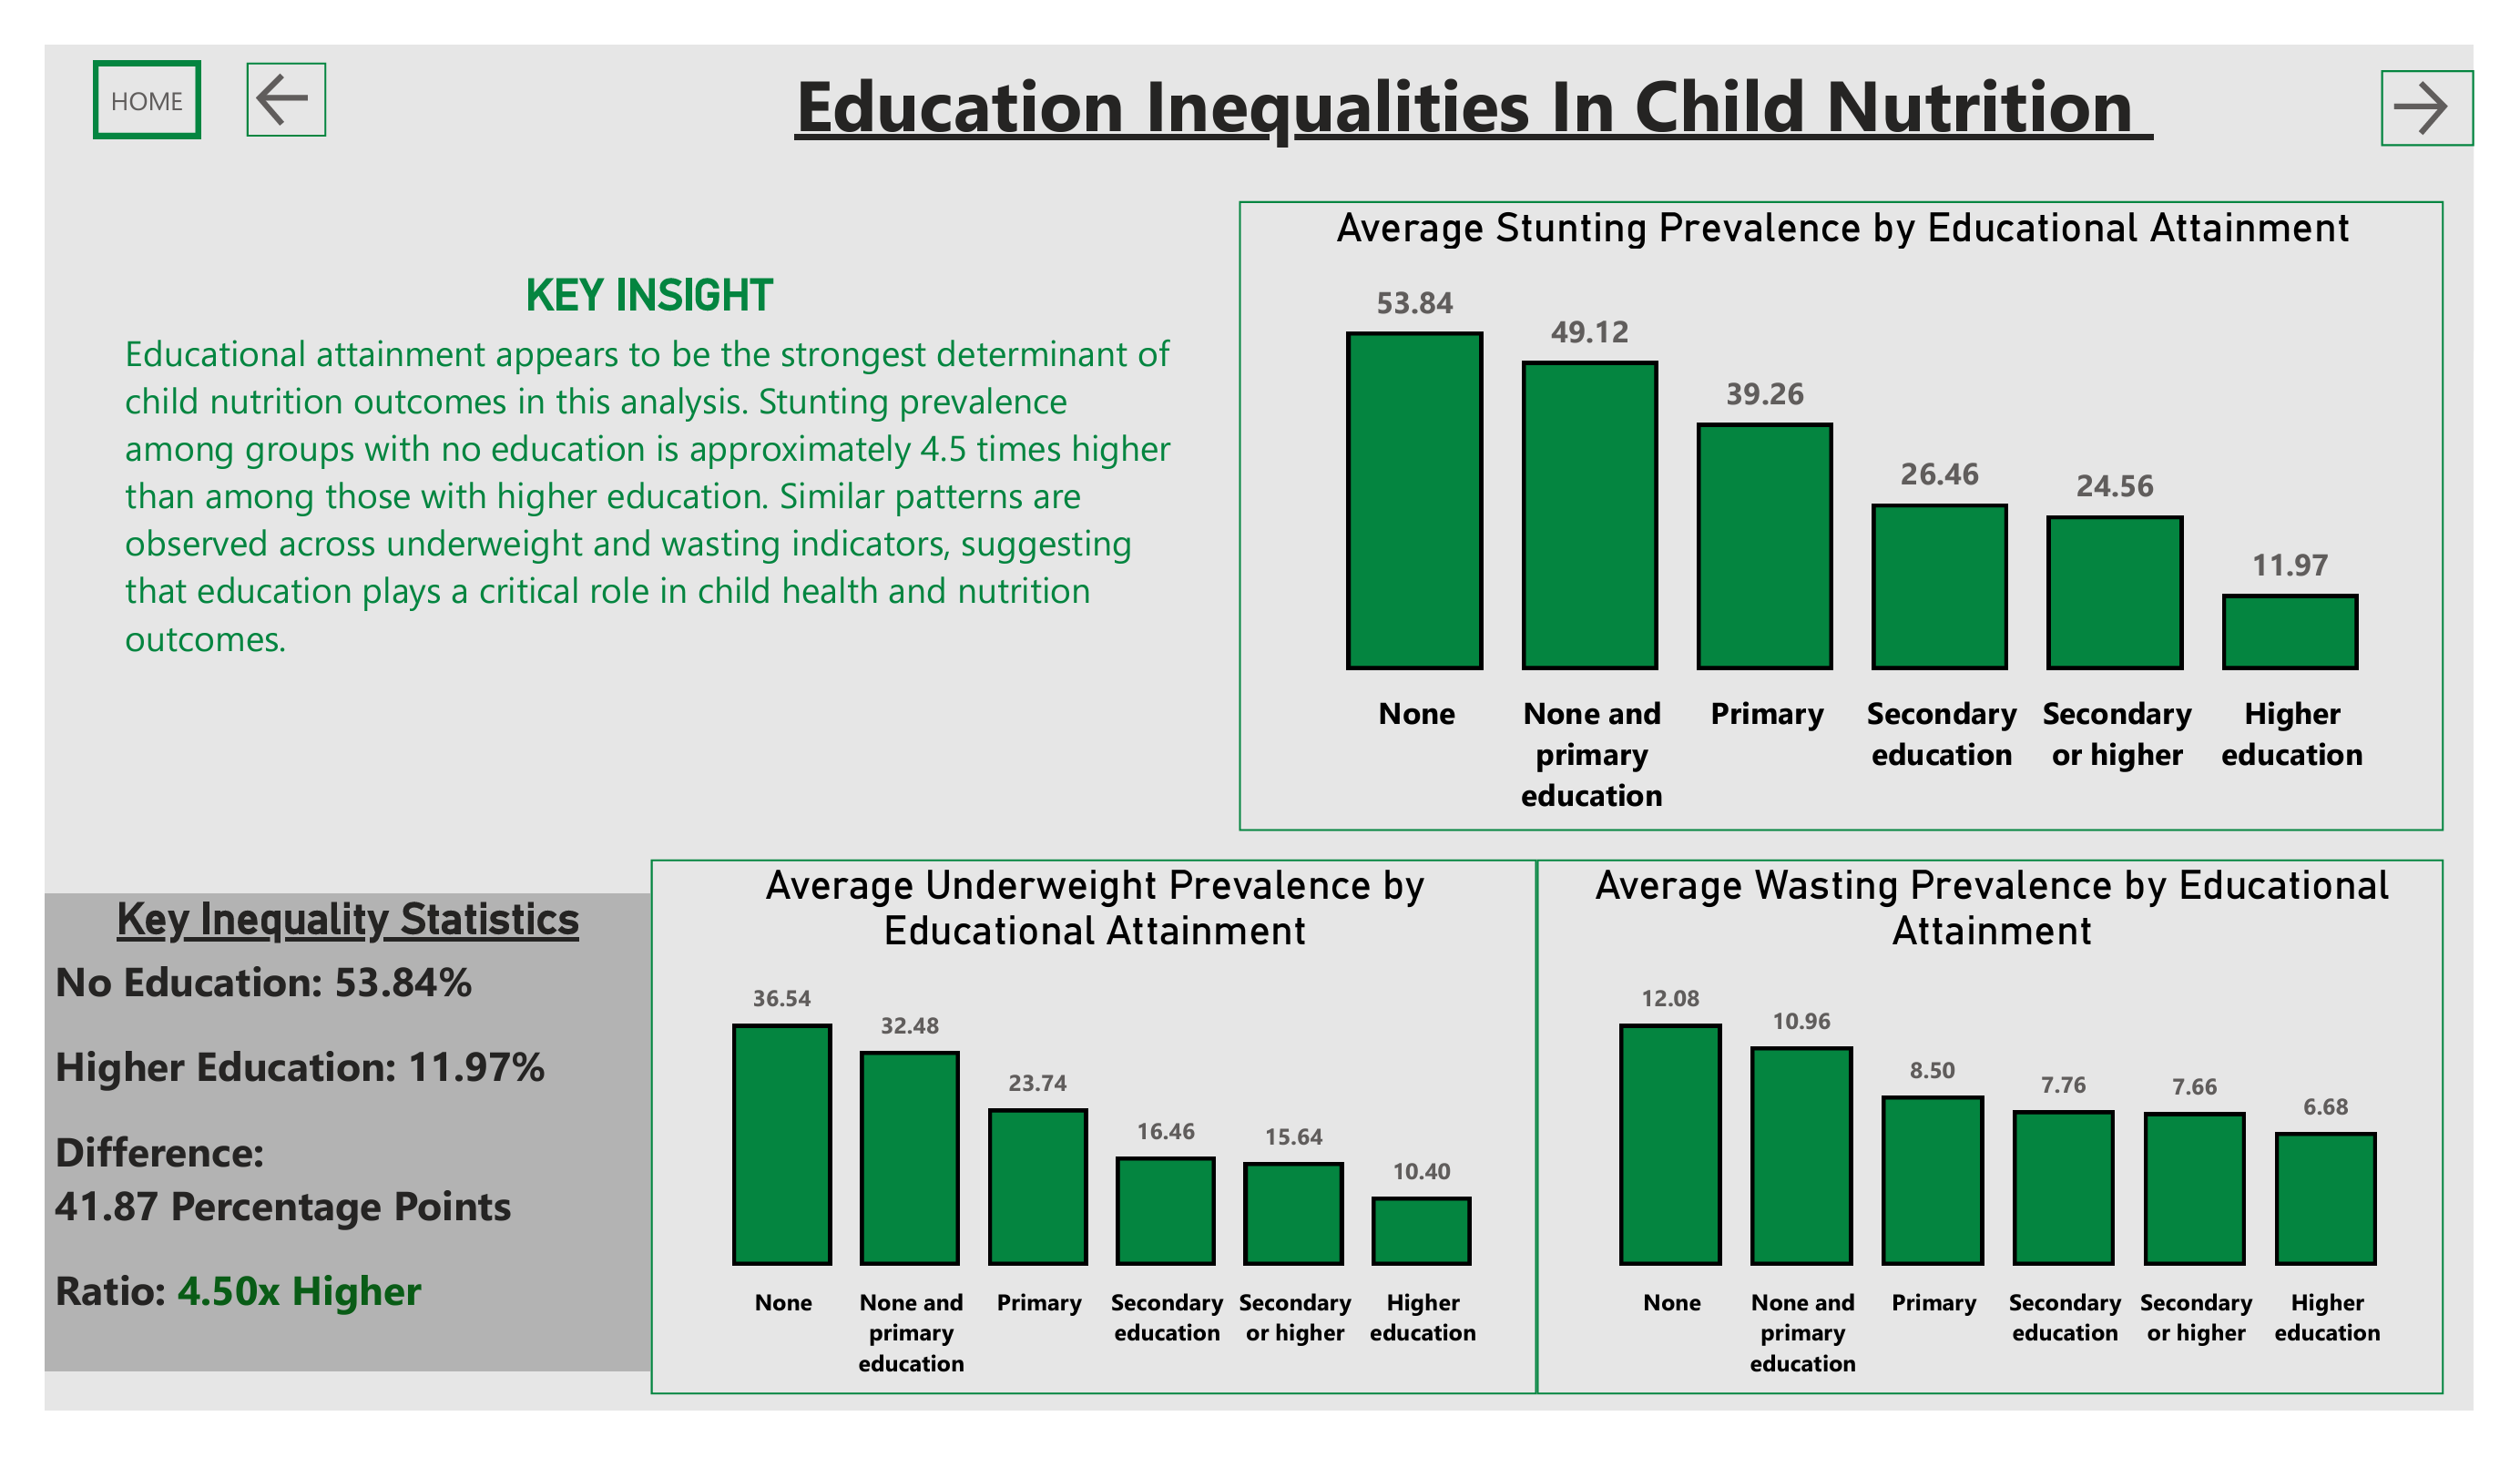
Educational attainment showed the strongest association with child nutrition outcomes in this analysis.

Children associated with no education experienced approximately 4.5× higher stunting prevalence than those associated with higher education.

03

Rural vs Urban

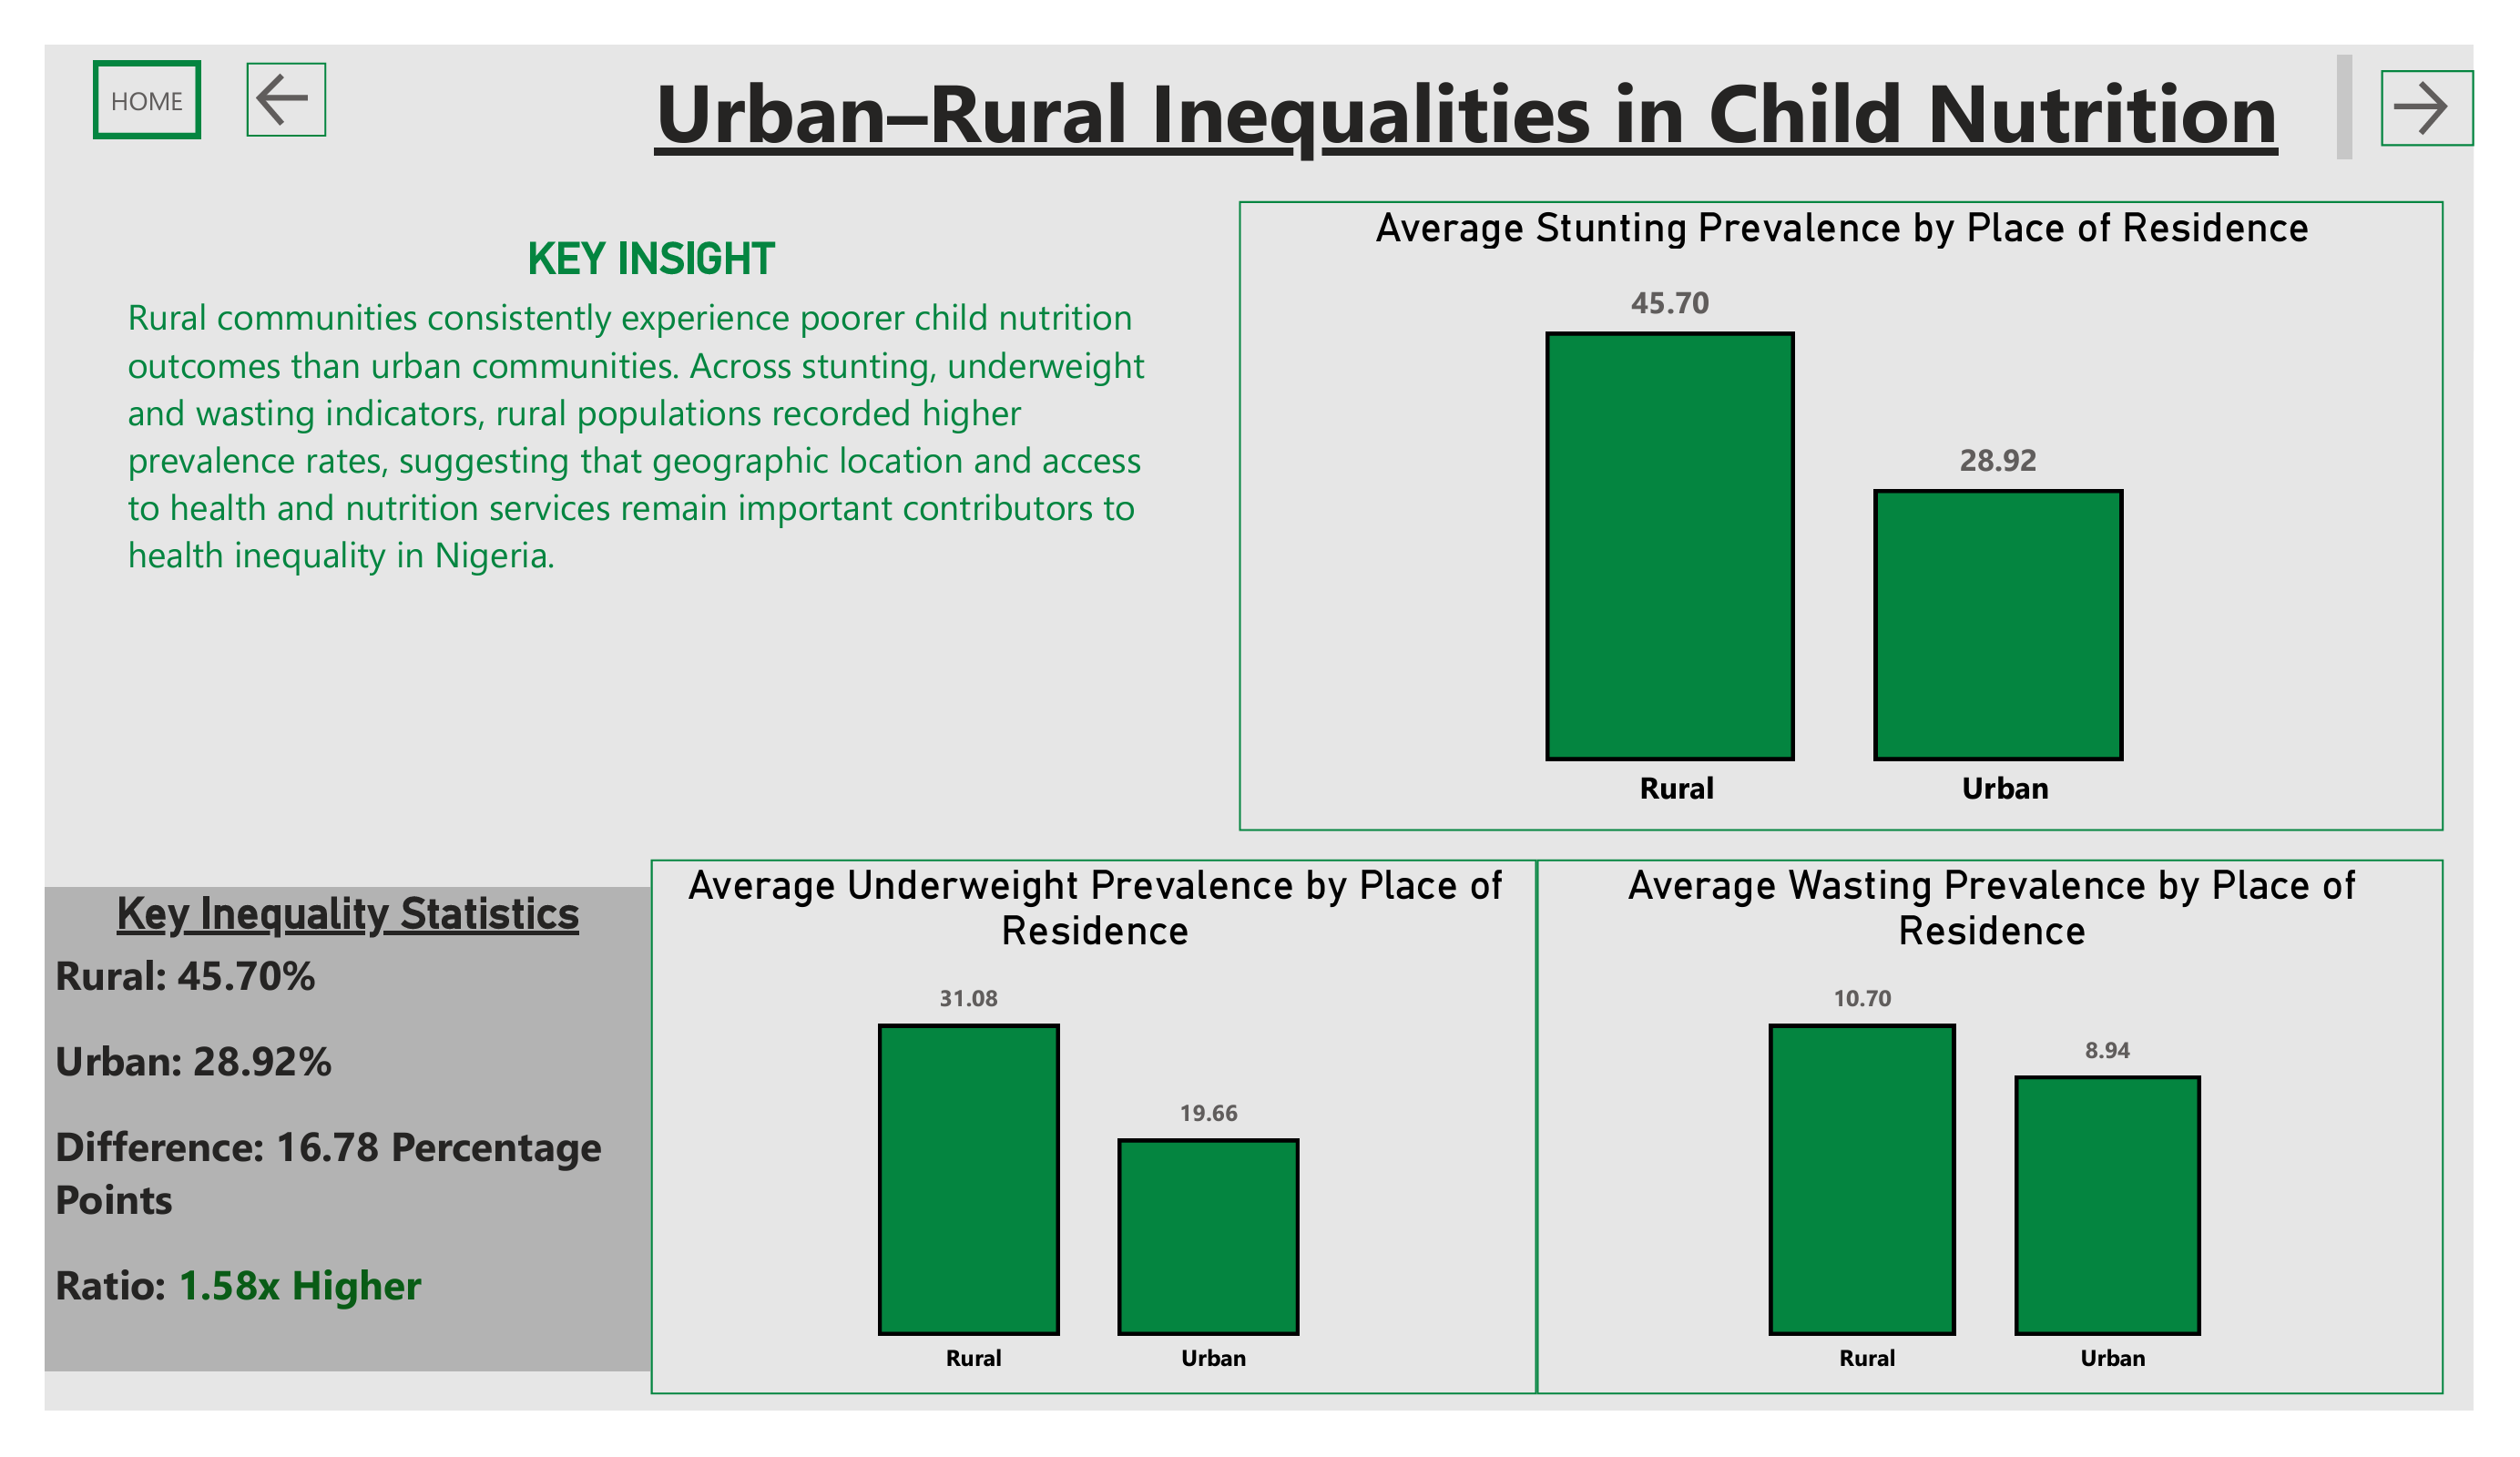
Rural communities consistently recorded worse nutrition outcomes than urban communities across all major indicators.

04

Overall Nutrition Challenge

Stunting emerged as the most severe nutrition challenge, followed by underweight and wasting.

Power BI Dashboard

The dashboard translates the analysis into an interactive visual story, allowing users to explore nutrition inequalities across different socioeconomic groups.

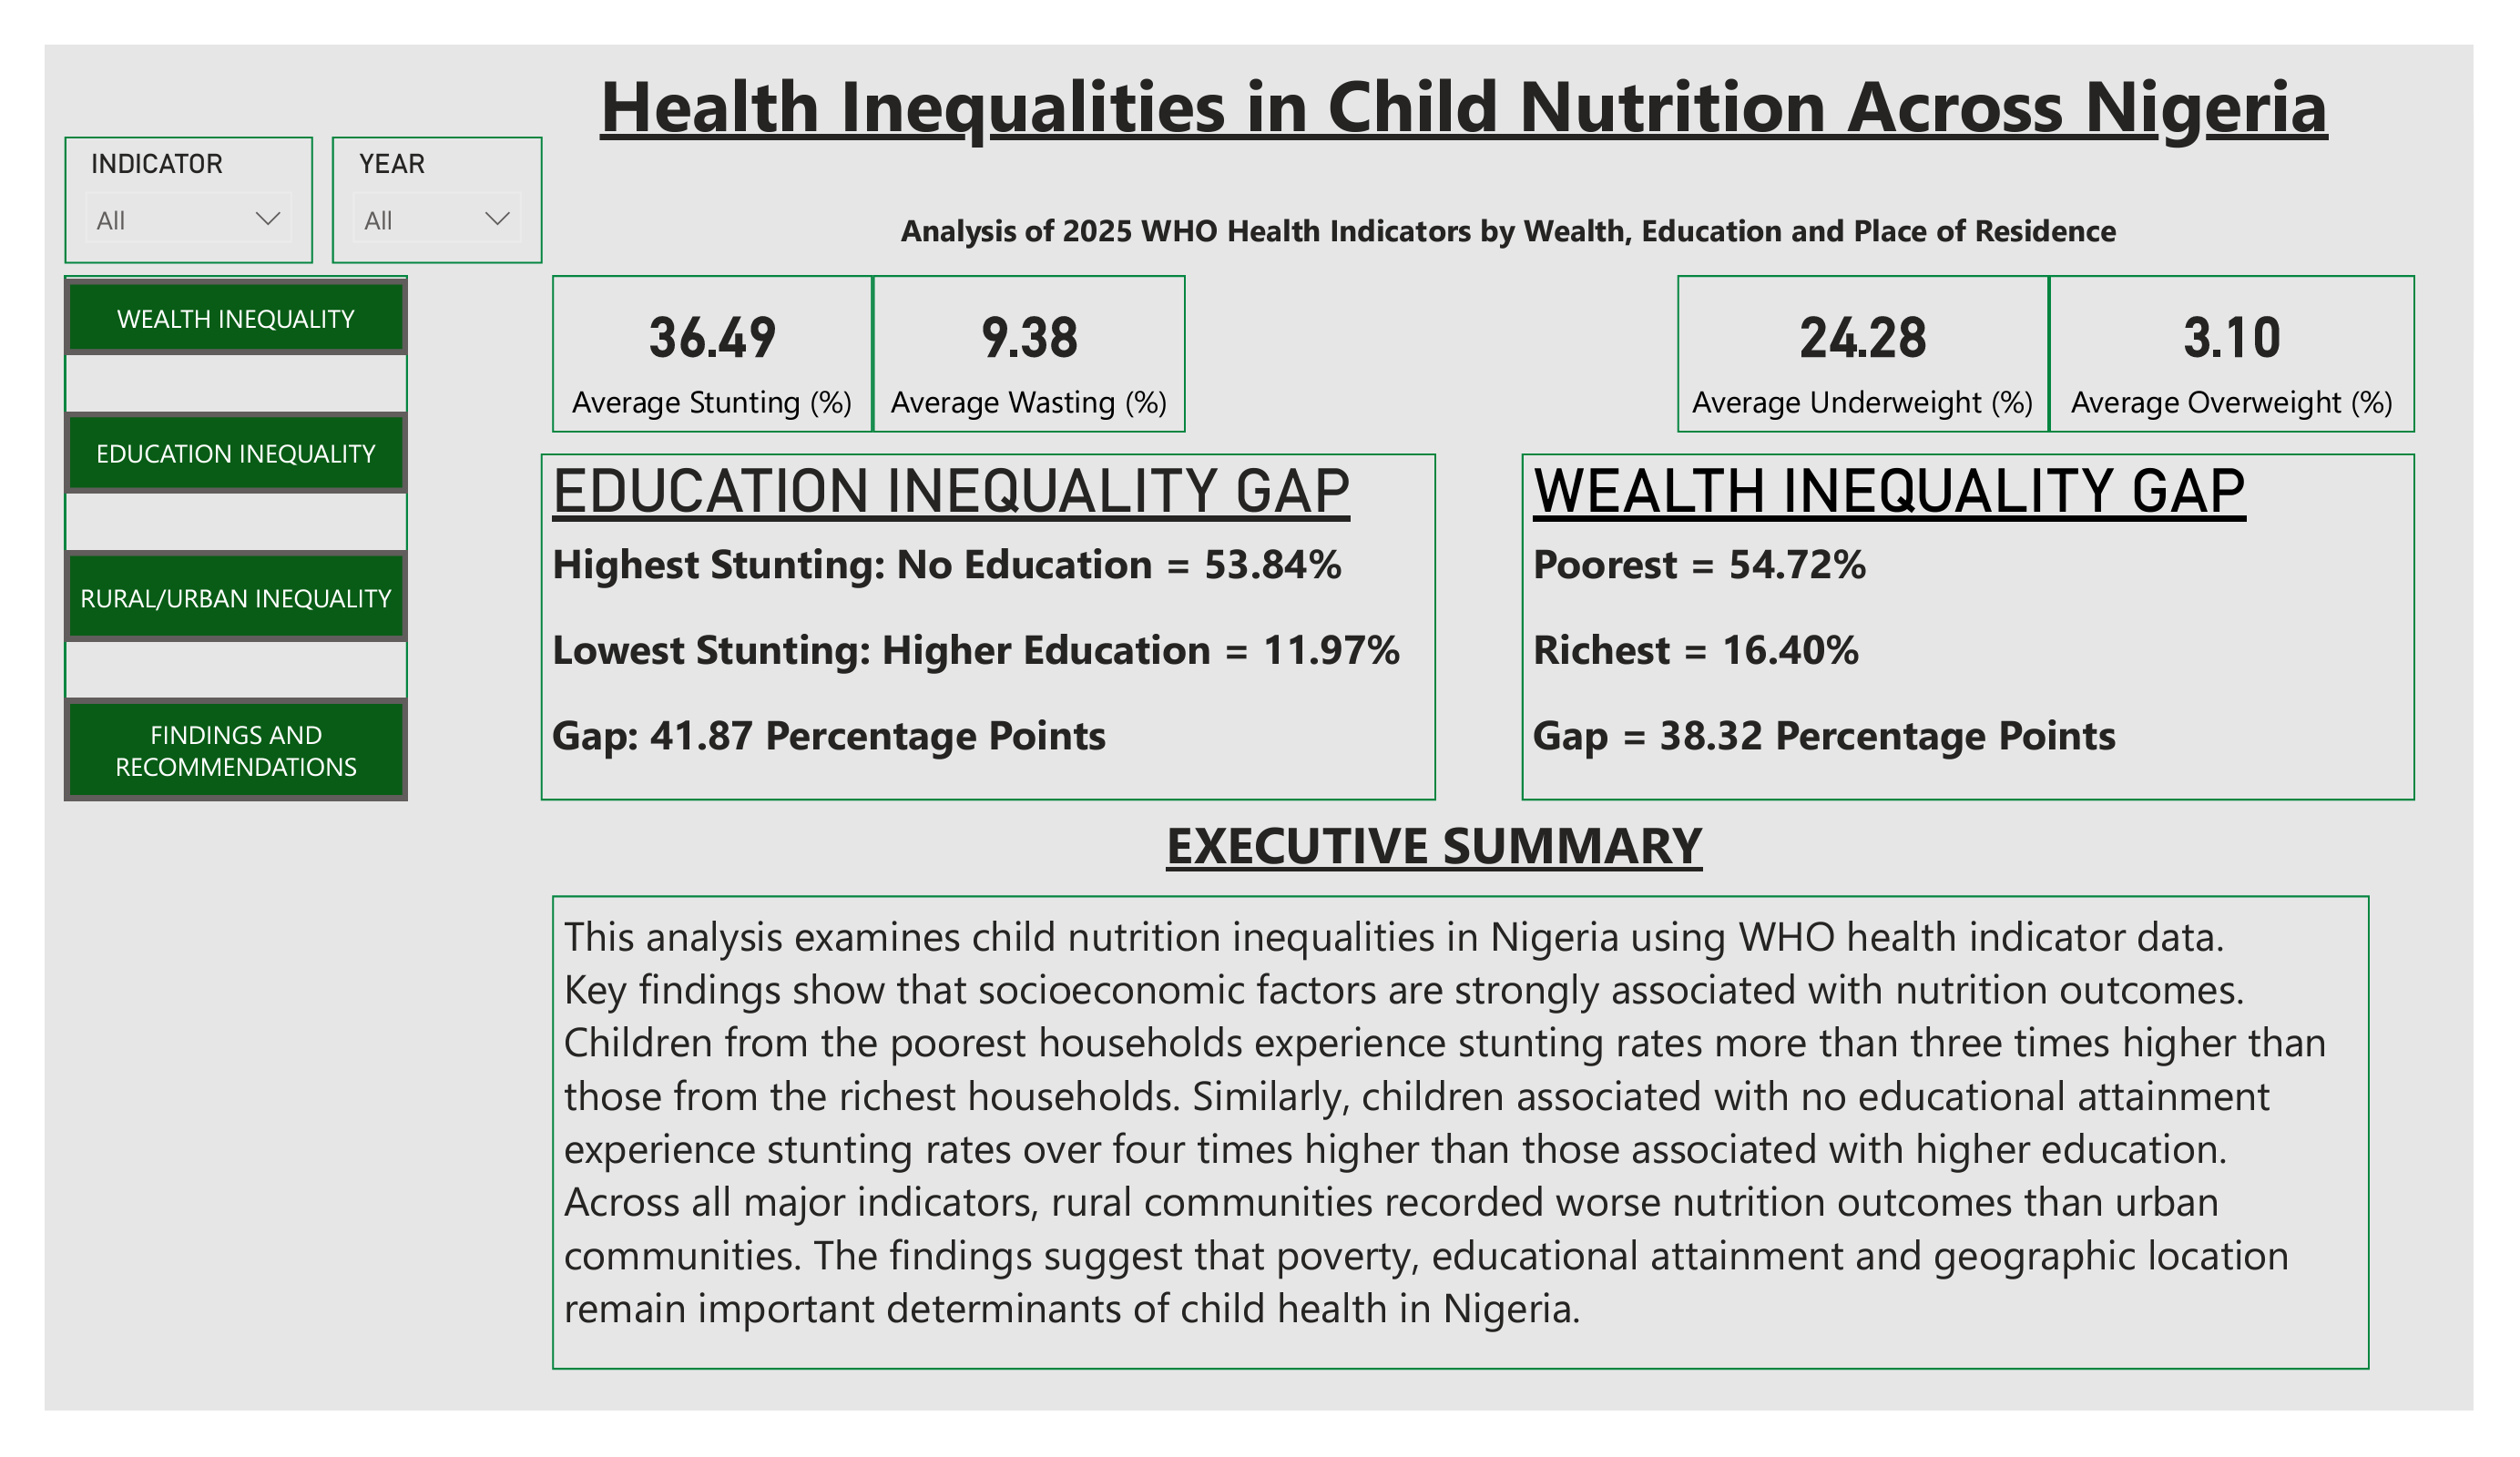
Health inequality executive summary dashboard

Executive Summary

Wealth inequality dashboard

Wealth Inequality

Educational inequality dashboard

Education Inequality

Rural versus urban inequality dashboard

Rural vs Urban Inequality

Recommendations

01

Prioritize nutrition interventions for low-income households, which experience substantially higher levels of child malnutrition.

02

Expand maternal, caregiver, and community education programs, particularly in underserved and rural communities where nutrition outcomes are consistently worse.

03

Continue monitoring child nutrition indicators through routine national surveys to track disparities and evaluate progress over time.

Skills Demonstrated

Excel SQL SQL Server Power BI DAX Data Cleaning Exploratory Data Analysis Data Visualization Dashboard Development Data Storytelling

Want to explore the project further?

Read the full story behind the analysis or explore the project repository and supporting files.